OPEN-SOURCE SCRIPT
[RickAtw] S1 Support and resistance
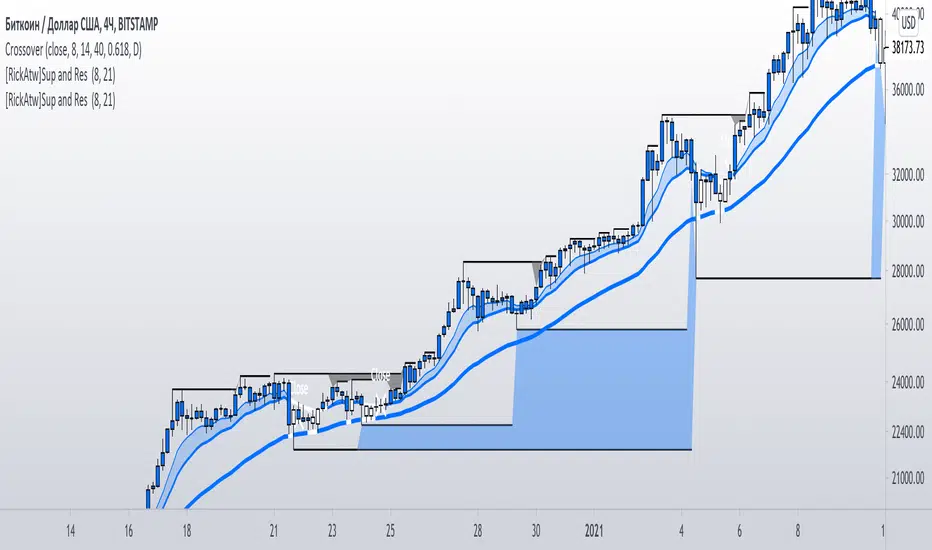
This indicator helps to identify the current support and resistance in the market.
Function
Shows at which points the correction appears and at which points there is resistance
Key Signal
buy ---> If a blue zone forms
sell --->If a black zone forms
Remarks
This helps you determine the approximate support and resistance area.
Since we cannot look into the future, it does not inform you about the exact entries, but it shows who is dominating the market at the moment.
Readme
In real life, I am a professional investor. And I check each of my indicators on my portfolio and how effective it is. I will not post a non-working method. The main thing is to wait for the beginning of trends and make money!
I would be grateful if you subscribe ❤️
開源腳本
秉持TradingView一貫精神,這個腳本的創作者將其設為開源,以便交易者檢視並驗證其功能。向作者致敬!您可以免費使用此腳本,但請注意,重新發佈代碼需遵守我們的社群規範。
免責聲明
這些資訊和出版物並非旨在提供,也不構成TradingView提供或認可的任何形式的財務、投資、交易或其他類型的建議或推薦。請閱讀使用條款以了解更多資訊。
免責聲明
這些資訊和出版物並非旨在提供,也不構成TradingView提供或認可的任何形式的財務、投資、交易或其他類型的建議或推薦。請閱讀使用條款以了解更多資訊。