OPEN-SOURCE SCRIPT
Donchian Channels + Avg Width % Dashboard
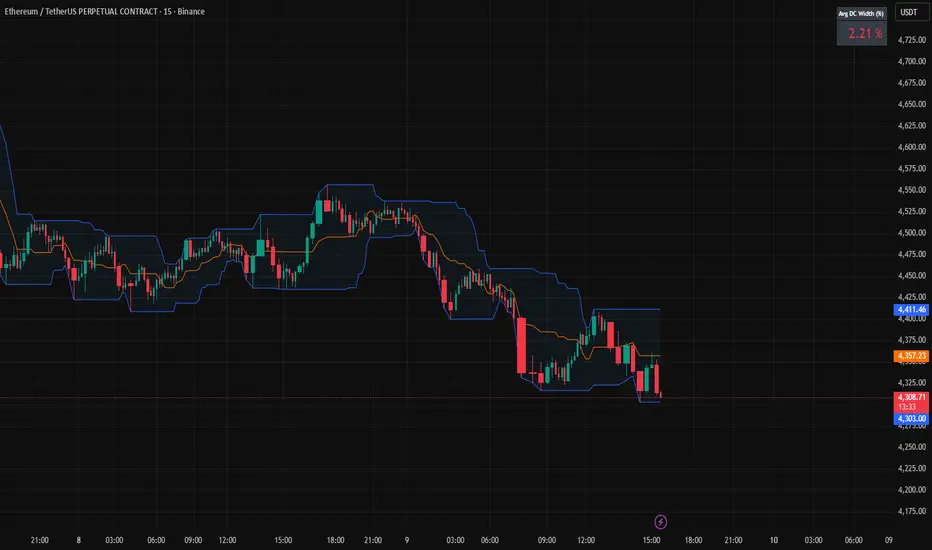
Measures the average percentage width between the Donchian Channel’s upper and lower bands over a chosen period.
It quantifies how much the market has been moving relative to price — a direct gauge of realized volatility.
When the average width is small, price is range-bound and unlikely to reach fixed TP targets; when it expands, volatility is sufficient for trend or breakout trades.
Based on how fast your strategy is, set your TP% below the average percentage of the Band Width.
開源腳本
秉持TradingView一貫精神,這個腳本的創作者將其設為開源,以便交易者檢視並驗證其功能。向作者致敬!您可以免費使用此腳本,但請注意,重新發佈代碼需遵守我們的社群規範。
免責聲明
這些資訊和出版物並非旨在提供,也不構成TradingView提供或認可的任何形式的財務、投資、交易或其他類型的建議或推薦。請閱讀使用條款以了解更多資訊。
開源腳本
秉持TradingView一貫精神,這個腳本的創作者將其設為開源,以便交易者檢視並驗證其功能。向作者致敬!您可以免費使用此腳本,但請注意,重新發佈代碼需遵守我們的社群規範。
免責聲明
這些資訊和出版物並非旨在提供,也不構成TradingView提供或認可的任何形式的財務、投資、交易或其他類型的建議或推薦。請閱讀使用條款以了解更多資訊。