PROTECTED SOURCE SCRIPT
Advanced Candle Patterns detector-GSK-VIZAG-AP-INDIA
📌 Description
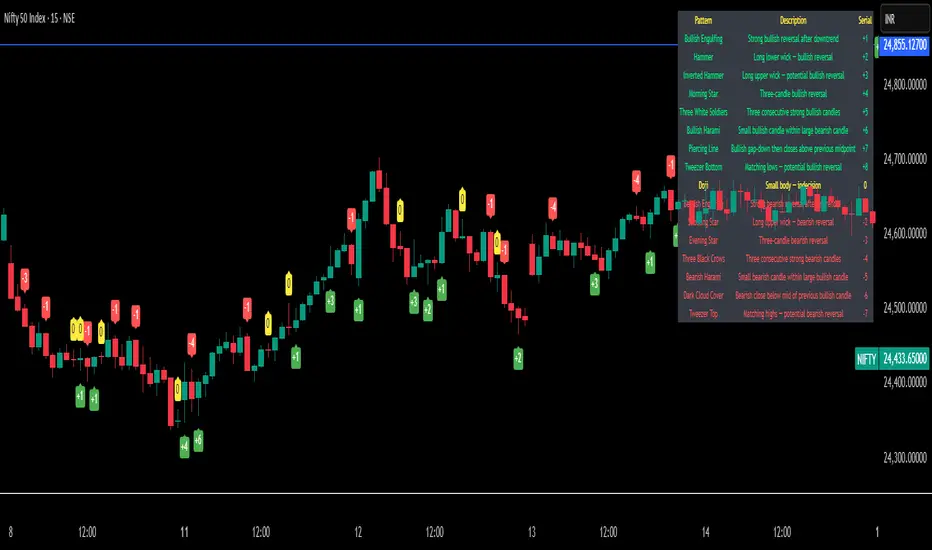
This indicator automatically detects and highlights common candlestick patterns on the chart and provides a reference table with explanations. It is designed as a visual and educational tool for learning candlestick psychology and price action.
🔍 Features
Pattern Detection (on-chart):
Detects well-known bullish, bearish, and neutral patterns:
Bullish Engulfing, Bearish Engulfing
Hammer, Inverted Hammer
Morning Star, Evening Star
Three White Soldiers, Three Black Crows
Bullish Harami, Bearish Harami
Piercing Line, Dark Cloud Cover
Tweezer Bottom, Tweezer Top
Doji
Patterns are marked directly on the chart using labels.
Labels can show pattern names or serial numbers (user choice).
Bullish = Green, Bearish = Red, Neutral = Yellow.
Reference Table (on-chart panel):
Lists all detected patterns with color-coded text.
Option to show short explanations for each pattern, or just identifiers.
Table includes a “Serial” column so users can match with chart labels.
Chart & Table Settings (customizable):
Table Position: choose Top Left, Top Right, Bottom Left, Bottom Right.
Text Size: choose Tiny, Small, Normal, Large, or Huge.
Toggle Options:
Show/Hide explanation table.
Show/Hide descriptions in table.
Show serial numbers instead of pattern labels on chart.
🎓 Educational Purpose
This tool is meant for study and research. Candlestick patterns alone are not reliable signals; their strength depends on trend, volume, and market context. Use this script to visually learn patterns and combine with other analysis methods.
⚠️ Disclaimer:
This indicator is for educational purposes only. It does not provide trading or investment advice. No candlestick pattern guarantees future price movement. Always confirm with other tools and do your own research before making trading decisions.
受保護腳本
此腳本以閉源形式發佈。 不過,您可以自由且不受任何限制地使用它 — 在此處了解更多資訊。
"Created by GSK-VIZAG-AP-INDIA"
免責聲明
這些資訊和出版物並不意味著也不構成TradingView提供或認可的金融、投資、交易或其他類型的意見或建議。請在使用條款閱讀更多資訊。
受保護腳本
此腳本以閉源形式發佈。 不過,您可以自由且不受任何限制地使用它 — 在此處了解更多資訊。
"Created by GSK-VIZAG-AP-INDIA"
免責聲明
這些資訊和出版物並不意味著也不構成TradingView提供或認可的金融、投資、交易或其他類型的意見或建議。請在使用條款閱讀更多資訊。