PROTECTED SOURCE SCRIPT
Extended Golden Ratio Fibonacci Multiplier + Pi Cycle Top
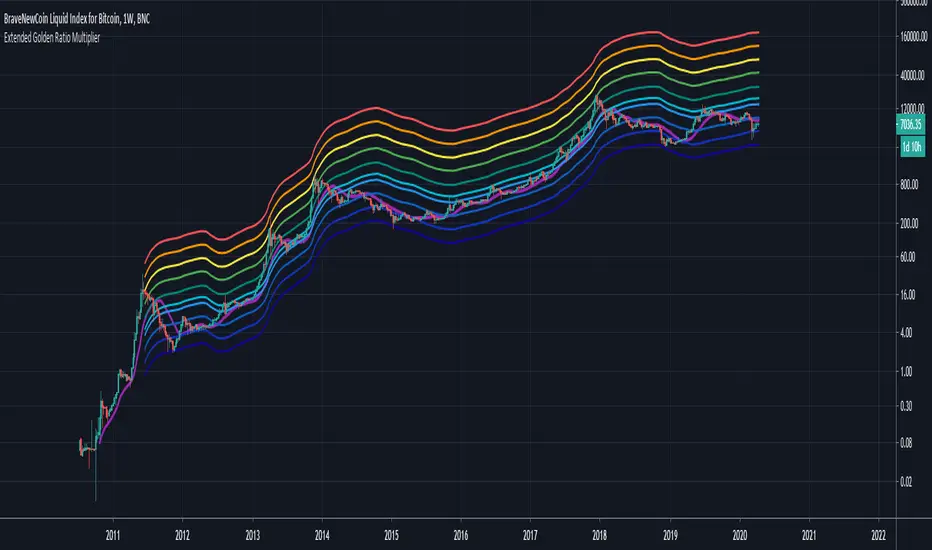
Here I present the Golden Ratio Multiplier and Pi Cycle Top Indicator originally conceptualized by Philip Swift, and extend it. Due to popular demand for a nicer looking color scheme and added MAs & functionalities, I decided to publish this indicator, of course with free access for everyone as the discovery is attributed to Philip. The indicator works best for BLX (BraveNewCoin Liquid Index for Bitcoin) on daily (D) or weekly (W) timeframe. Other timeframes are not supported (and also generally not needed as this is a rather high timeframe indicator).
Added functionality:
- Additional Fibonacci MAs for Bottom: 0.618*MA(50W) and 0.382*MA(50W), which seem to be distinct high timeframe support MAs
- Pi Cycle Top and all Fibonacci MAs can be plotted or hidden individually
- Correct MA values for daily (D) and weekly (W) timeframes are automatically assigned, so you do not need to change anything when you switch between those timeframes.
It is generally said that Bitcoin's peaks always only reach a lower yearly Fibonacci MA. The next one to eye would be the 3*MA(50W) = 3*MA(350D) here plotted in dark green. Historically when the MA(16W) = MA(111D) (here plotted in magenta) line crossed the 2*MA(50W) = 2*(350D) line (plotted in cyan) from below a cycle peak is reached. This indicator might therefore be a good high timeframe indicator for Bitcoin trading. Of course this is no financial advice.
受保護腳本
此腳本以閉源形式發佈。 不過,您可以自由且不受任何限制地使用它 — 在此處了解更多資訊。
免責聲明
這些資訊和出版物並不意味著也不構成TradingView提供或認可的金融、投資、交易或其他類型的意見或建議。請在使用條款閱讀更多資訊。
受保護腳本
此腳本以閉源形式發佈。 不過,您可以自由且不受任何限制地使用它 — 在此處了解更多資訊。
免責聲明
這些資訊和出版物並不意味著也不構成TradingView提供或認可的金融、投資、交易或其他類型的意見或建議。請在使用條款閱讀更多資訊。