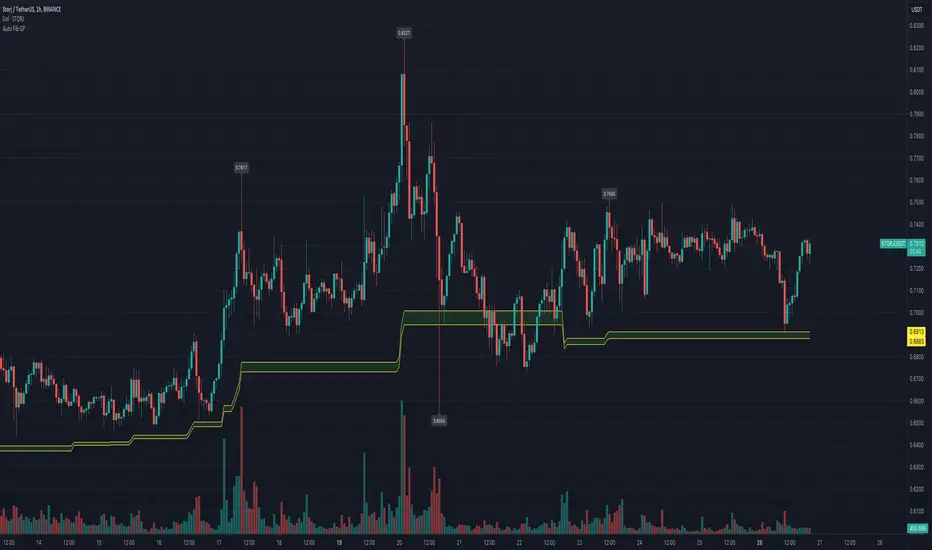
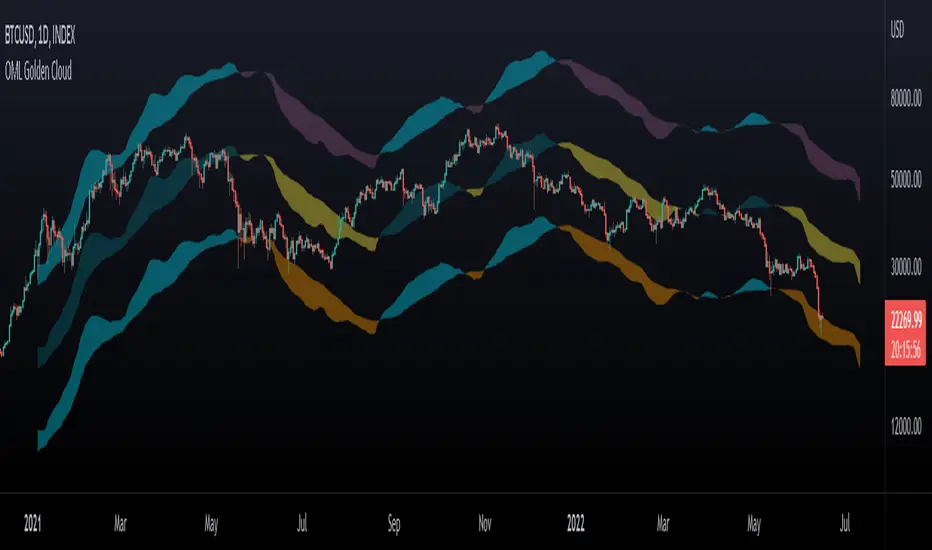
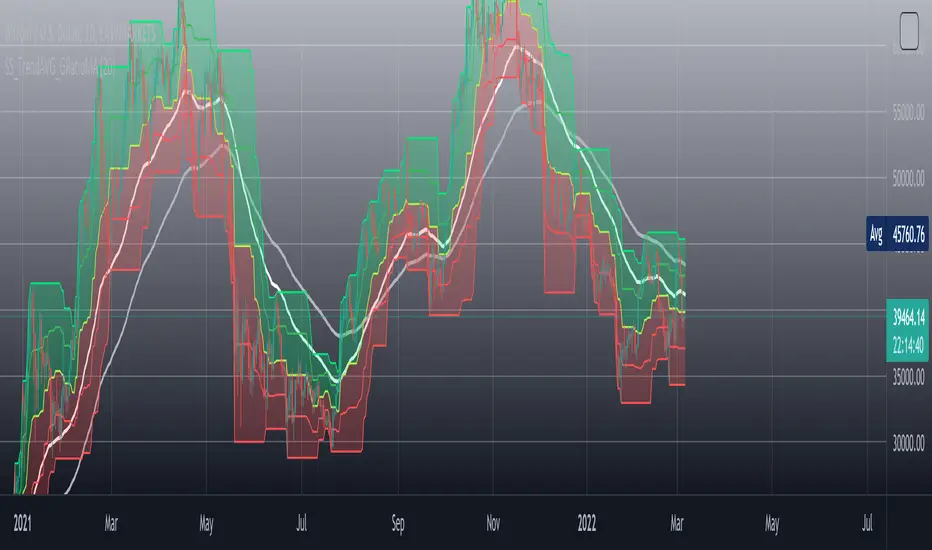
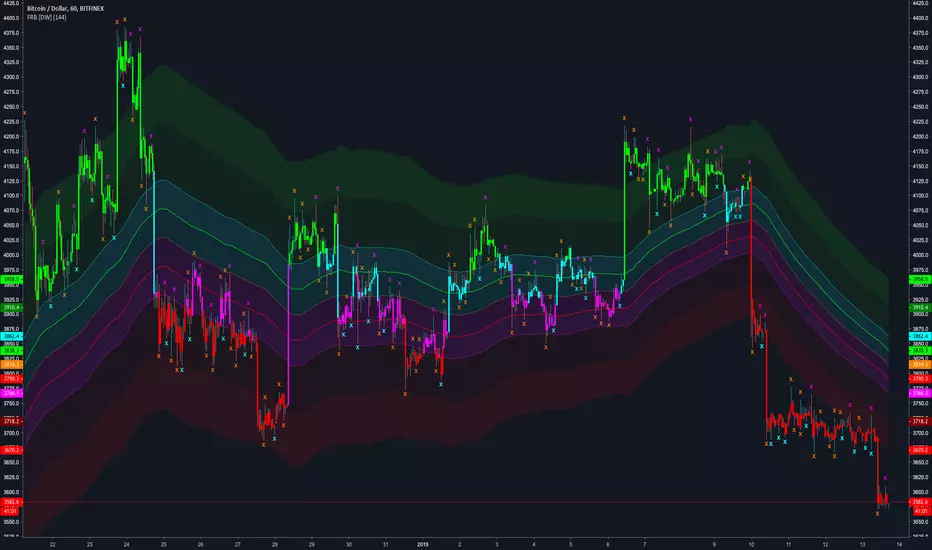
Takhtupuria Pro master V2..7Takhtupuria Pro V2
The Takhtupuria Pro V2 is an advanced, all-in-one trading indicator designed for precision scalping and trend-following. By integrating Golden Ratio logic, EMA crossovers, and Fibonacci levels, this tool provides a comprehensive system for modern traders.
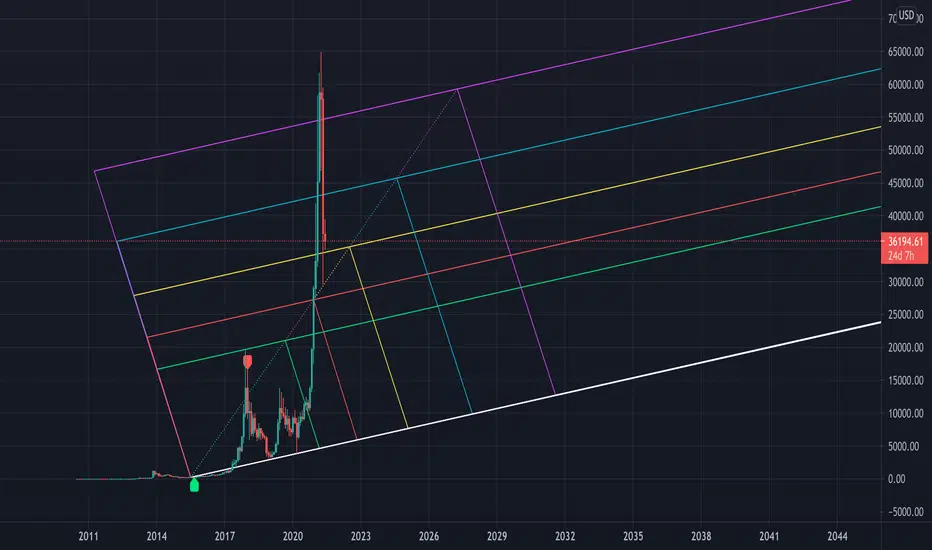
Key Features:
Golden Ratio Signals: Integrated logic to identify potential "Golden Ratio" setups for both standard and reversed market trends.
Scalping Precision: Features a high-speed 5 EMA + 200 EMA trigger system, optimized for rapid scalping execution.
Fibonacci Integration: Automatic plotting of key Fibonacci levels (Top, Mid, Bottom) to identify support and resistance zones instantly.
Advanced Filters: Includes customizable distance (%) and candle-count settings to ensure high-probability entry points.
Visual Signals: Automated Buy/Sell arrows with configurable visual alerts for real-time decision-making.
How to Use:
Inputs: Adjust your "Distance %" and "Candle Count" to calibrate the sensitivity of the scalping system to your specific asset.
Fibonacci: Set your preferred Fibonacci Timeframe (e.g., 15 minutes) to align with your overall strategy.
Style: Fully customize the colors for EMA lines, Fib levels, and signal arrows to match your chart's unique layout.
Designed by Takhtupuria for traders who require a multi-layered analytical approach in a single, powerful tool. 指標

Harmonic Resonance Detector [JOAT]Harmonic Resonance Detector
Introduction
The Harmonic Resonance Detector is an advanced open-source Fibonacci analysis indicator that combines multi-wave Fibonacci retracements, confluence zone detection, golden ratio harmonics, and density heatmapping into a unified harmonic analysis system. This indicator helps traders identify high-probability reversal and continuation zones by analyzing where multiple Fibonacci levels from different swing waves converge, creating magnetic price attraction zones.
Unlike basic Fibonacci tools that draw levels from a single swing, this system analyzes three simultaneous swing waves (primary, secondary, tertiary) and identifies where their Fibonacci levels cluster. These confluence zones represent areas where multiple timeframes and swing structures agree on key levels, significantly increasing the probability of price reaction. The indicator is designed for traders who understand that Fibonacci levels work best when multiple waves confirm the same price zone.
Why This Indicator Exists
This indicator addresses a fundamental limitation of traditional Fibonacci analysis: single-swing Fibonacci levels are subjective and often unreliable. Different traders draw different swings and get different levels. By combining multiple swing analyses and identifying confluence, this indicator reveals:
Triple Swing Analysis: Analyzes three different swing lengths simultaneously (20, 50, 100 periods) to capture short, medium, and long-term structure
Confluence Zone Detection: Identifies where multiple Fibonacci levels cluster within tolerance - these zones act as price magnets
Golden Pocket Highlighting: Marks the 0.618-0.65 retracement zone - the highest probability reversal area based on golden ratio
Fibonacci Extensions: Projects 1.272, 1.414, and 1.618 extension levels for profit targets beyond the swing range
Density Heatmap: Visual representation of Fibonacci level concentration - darker colors = more confluence
Liquidity Sweep Detection: Identifies when price breaks highs/lows but closes back inside - signals institutional traps
Each component provides a different lens on harmonic structure. Triple swing analysis shows multi-timeframe agreement, confluence zones show magnetic levels, golden pocket shows optimal entry, extensions show targets, heatmap shows density, and sweeps show manipulation. Together, they create a comprehensive view of harmonic resonance.
Core Components Explained
1. Triple Swing Fibonacci Analysis
The indicator calculates Fibonacci retracements from three different swing lengths simultaneously:
// Calculate swing high/low for each period
swingHigh1 = ta.highest(high, 20) // Primary wave
swingLow1 = ta.lowest(low, 20)
swingHigh2 = ta.highest(high, 50) // Secondary wave
swingLow2 = ta.lowest(low, 50)
swingHigh3 = ta.highest(high, 100) // Tertiary wave
swingLow3 = ta.lowest(low, 100)
// Calculate Fibonacci levels for each swing
fib1 = calculateFibs(swingHigh1, swingLow1)
fib2 = calculateFibs(swingHigh2, swingLow2)
fib3 = calculateFibs(swingHigh3, swingLow3)
For each swing, the indicator calculates standard Fibonacci retracement levels:
23.6% - Shallow retracement, weak pullback
38.2% - Moderate retracement, common in strong trends
50.0% - Equilibrium level, psychological significance
61.8% - Golden ratio, highest probability reversal zone
78.6% - Deep retracement, last chance before trend failure
By analyzing three different swing lengths, the indicator captures short-term, medium-term, and long-term structure simultaneously. When levels from all three swings align, it creates powerful confluence.
2. Confluence Zone Detection
The indicator identifies zones where multiple Fibonacci levels cluster within a tolerance percentage:
confluenceTolerance = 0.3 // Default 0.3%
// For each Fibonacci level, count how many other levels are nearby
for each level in allFibLevels:
confluenceCount = 0
for each otherLevel in allFibLevels:
if abs(level - otherLevel) / level * 100 <= confluenceTolerance:
confluenceCount += 1
if confluenceCount >= 3: // Minimum 3 levels clustering
createConfluenceZone(level, confluenceCount)
Confluence zones are displayed as:
Horizontal boxes spanning the tolerance range
Color intensity based on confluence count (4+ levels = red, 3 levels = orange, 2 levels = yellow)
Labels showing "3x CONFLUENCE", "4x CONFLUENCE", etc.
Thicker borders for higher confluence zones
The more Fibonacci levels that converge at a price zone, the stronger the magnetic effect. 4x or 5x confluence zones are extremely high-probability reaction areas.
3. Golden Pocket Visualization
The Golden Pocket is the zone between 0.618 and 0.65 Fibonacci retracement - the highest probability reversal area:
fib618 = swingLow + (swingHigh - swingLow) * 0.618
fib650 = swingLow + (swingHigh - swingLow) * 0.650
goldenTop = max(fib618, fib650)
goldenBottom = min(fib618, fib650)
The Golden Pocket is special because:
Based on the golden ratio (phi = 1.618), found throughout nature and markets
Represents optimal balance between retracement depth and trend continuation
Historically shows highest win rate for reversal trades
Often coincides with institutional order placement zones
The indicator highlights the Golden Pocket with:
Multi-layer gradient gold box
"GOLDEN POCKET" label at center
Enhanced candlestick coloring when price is inside (gold for bullish, brown for bearish)
Background gradient when price enters the zone
4. Fibonacci Extensions
Extensions project levels beyond the swing range for profit targets:
// Extension levels
ext1272 = swingLow + (swingHigh - swingLow) * 1.272
ext1414 = swingLow + (swingHigh - swingLow) * 1.414
ext1618 = swingLow + (swingHigh - swingLow) * 1.618
Extension levels represent:
127.2% - First extension target, common profit-taking zone
141.4% - Square root of 2, geometric harmony level
161.8% - Golden ratio extension, major target zone
Extensions are drawn as dashed lines with purple gradient colors. They show where price is likely to find resistance after breaking through the swing high (or support after breaking swing low).
5. Confluence Density Heatmap
The heatmap visualizes Fibonacci level concentration across the price range:
The indicator:
Divides the recent price range into 20 grid cells
Counts how many Fibonacci levels fall into each cell
Colors cells based on density (blue = low, red = high)
Displays as vertical bars on the left side of the chart
The heatmap reveals:
Zones with highest Fibonacci concentration (darkest red)
Gaps where few Fibonacci levels exist (blue or empty)
Vertical distribution of harmonic structure
Quick visual reference for key zones
Traders can quickly identify the most important price levels by looking for the darkest red cells in the heatmap.
6. Liquidity Sweep Detection
Liquidity sweeps occur when price breaks a swing high/low but closes back inside the range - a classic institutional trap:
// Detect sweep: high breaks previous swing high but close is below it
liquiditySweepHigh = high > prevSwingHigh and close < prevSwingHigh
// Detect sweep: low breaks previous swing low but close is above it
liquiditySweepLow = low < prevSwingLow and close > prevSwingLow
When sweeps occur:
Dashed horizontal line marks the swept level
"LIQ SWEEP" label appears
Often precedes reversal as institutions trapped retail traders
Combines with Fibonacci confluence for high-probability setups
Liquidity sweeps at Fibonacci confluence zones are especially powerful - they signal institutional positioning complete and reversal imminent.
7. Equilibrium Boxes (EQH/EQL)
Equilibrium boxes mark 50% retracement zones throughout the chart:
The indicator:
Identifies significant ranges throughout lookback period
Calculates 50% level (equilibrium) for each range
Draws grey boxes around equilibrium with dashed center line
Labels with "EQH" (Equal Highs) marker
Equilibrium zones represent fair value and often act as support/resistance. Price tends to gravitate toward equilibrium before continuing or reversing.
Visual Elements
Fibonacci Lines: Dotted lines at 23.6%, 38.2%, 50%, 61.8%, 78.6% with color coding
Extension Lines: Dashed purple lines at 127.2%, 141.4%, 161.8%
Confluence Zones: Horizontal boxes with intensity-based coloring and count labels
Golden Pocket: Multi-layer gradient gold box with center label
Density Heatmap: Vertical gradient bars showing Fibonacci concentration
Liquidity Sweeps: Dashed lines with "LIQ SWEEP" labels
Equilibrium Boxes: Grey boxes with dashed center lines and "EQH" labels
Enhanced Candles: Gold/orange coloring in Golden Pocket, red/green at confluence zones
Background Gradients: Premium zone (red), Discount zone (green), Golden Pocket (gold)
Dashboard: Real-time confluence metrics and trade signals
The dashboard displays 8 key metrics:
1. Active Zones (count of confluence zones)
2. Peak Confluence (highest confluence count)
3. Nearest Zone (distance to closest confluence)
4. Magnetic Pull (Extreme/Strong/Moderate/Weak)
5. Golden Zone (Active/Inactive)
6. Heatmap Density (total Fibonacci levels)
7. Trade Signal (Sniper Entry/Valid Setup/Wait)
Input Parameters
Harmonic Waves:
Primary Wave: First swing length (default: 20)
Secondary Wave: Second swing length (default: 50)
Tertiary Wave: Third swing length (default: 100)
Golden Pocket: Enable 0.618-0.65 zone highlighting
Confluence Engine:
Resonance Tolerance: Percentage range for confluence (default: 0.3%)
Min Harmonic Count: Minimum levels required for confluence (default: 3)
Magnetic Zones: Enable/disable confluence zone boxes
Visualization:
Fibonacci Levels: Show/hide retracement lines
Confluence Zones: Show/hide confluence boxes
Density Heatmap: Show/hide vertical heatmap
Extensions: Show/hide 1.272, 1.414, 1.618 levels
Equilibrium Boxes: Show/hide EQH zones
Liquidity Sweeps: Show/hide sweep markers
Gradient Backgrounds: Show/hide value zone colors
Enhanced Candlesticks: Enable special candle coloring
How to Use This Indicator
Step 1: Identify Confluence Zones
Look for horizontal boxes with "3x CONFLUENCE" or higher labels. These are magnetic zones where price is likely to react. 4x+ confluence = highest probability.
Step 2: Check Golden Pocket Status
Dashboard shows if Golden Pocket is active. When price enters the golden zone (0.618-0.65), it's optimal reversal area. Candles turn gold.
Step 3: Monitor Nearest Zone Distance
Dashboard shows distance to nearest confluence. <0.5% = price is at the zone. <1.0% = approaching. >2.0% = far away.
Step 4: Assess Magnetic Pull Strength
Dashboard shows pull strength. "EXTREME" = 4+ confluence within 0.5%. "STRONG" = 3+ confluence within 1.0%. Trade extreme and strong only.
Step 5: Watch for Liquidity Sweeps
When price sweeps a high/low at a confluence zone and reverses, it's a sniper entry. Institutions trapped retail and are now reversing.
Step 6: Use Extensions for Targets
After entry at confluence zone, use extension levels (127.2%, 141.4%, 161.8%) as profit targets. These are natural resistance/support zones.
Step 7: Check Trade Signal
Dashboard shows "SNIPER ENTRY" when price is within 0.5% of 4+ confluence. "VALID SETUP" for 3+ confluence within 1.0%. "WAIT" otherwise.
Best Practices
Higher confluence = higher probability - prioritize 4x+ zones
Golden Pocket + confluence = best reversal setups
Liquidity sweeps at confluence zones = institutional positioning
Use heatmap for quick visual reference of key zones
Extensions work best after confluence zone holds
Equilibrium boxes show fair value - expect gravitational pull
Premium/discount background shows context - buy discount, sell premium
Enhanced candles signal when price is at key zones
Multiple timeframe confluence (all three swings) = strongest setups
Confluence zones can act as support after breaking resistance (and vice versa)
Indicator Limitations
Fibonacci analysis is subjective - different swing selections produce different levels
Confluence zones show where levels cluster, not guaranteed reversals
Golden Pocket doesn't always hold - strong trends can blow through it
Liquidity sweeps can extend further than expected (double sweeps)
Heatmap density doesn't account for level importance (all levels weighted equally)
Extensions may not be reached in weak trends
Tolerance setting affects confluence detection - too tight misses zones, too wide creates false zones
The indicator shows harmonic structure, not fundamental drivers
Confluence zones can fail during news events or market shocks
Technical Implementation
Built with Pine Script v6 using:
Triple swing Fibonacci calculations with automatic trend detection
Confluence detection algorithm with tolerance-based clustering
Golden Pocket identification and highlighting system
Fibonacci extension projections (1.272, 1.414, 1.618)
Density heatmap with grid-based level counting
Liquidity sweep detection with close confirmation
Equilibrium box generation throughout chart history
Enhanced candlestick coloring based on zone proximity
Multi-gradient background system for value zones
Real-time dashboard with 8 harmonic metrics
The code is fully open-source and can be modified to suit individual trading styles and preferences.
Originality Statement
This indicator is original in its comprehensive harmonic integration approach. While individual components (Fibonacci retracements, golden ratio, extensions) are established concepts, this indicator is justified because:
It synthesizes three simultaneous swing analyses into unified confluence detection
The confluence algorithm identifies clustering zones with configurable tolerance
Golden Pocket highlighting with enhanced visualization and candlestick coloring
Density heatmap provides visual representation of Fibonacci concentration
Liquidity sweep detection combines with Fibonacci zones for trap identification
Equilibrium box system marks fair value zones throughout chart history
Multi-gradient background system shows premium/discount context
Magnetic pull strength quantification based on confluence and proximity
Real-time dashboard presents 8 metrics simultaneously for holistic harmonic analysis
Each component contributes unique information: Triple swings show multi-timeframe structure, confluence shows magnetic zones, golden pocket shows optimal entry, extensions show targets, heatmap shows density, sweeps show manipulation, and equilibrium shows fair value. The indicator's value lies in presenting these complementary perspectives simultaneously with unified classification and actionable trade signals.
Disclaimer
This indicator is provided for educational and informational purposes only. It is not financial advice or a recommendation to buy or sell any financial instrument. Trading involves substantial risk of loss and is not suitable for all investors.
Fibonacci analysis is a tool for identifying potential support and resistance zones, not a crystal ball for predicting future price movement. Confluence zones do not guarantee reversals. Golden Pocket does not guarantee entries. Extensions may not be reached. Past harmonic patterns do not guarantee future harmonic patterns. Market conditions change, and strategies that worked historically may not work in the future.
The zones displayed are analytical constructs based on current market data, not predictions of future price movement. High confluence scores do not guarantee profitable trades. Users must conduct their own analysis and risk assessment before making trading decisions.
Always use proper risk management, including stop losses and position sizing appropriate for your account size and risk tolerance. Never risk more than you can afford to lose. Consider consulting with a qualified financial advisor before making investment decisions.
The author is not responsible for any losses incurred from using this indicator. Users assume full responsibility for all trading decisions made using this tool.
-Made with passion by officialjackofalltrades 指標

指標

Automatic Fibonacci Levels [WillyAlgoTrader]Automatic Fibonacci Levels is an overlay indicator that detects the dominant swing high and swing low within the visible chart area, draws a full Fibonacci retracement and extension grid between them, highlights the Optimal Trade Entry (OTE) zone at 61.8%–78.6%, marks a target zone at the −50% to −61.8% extension, and labels four take-profit levels — all updating automatically as you scroll or zoom the chart.
Most Fibonacci tools on TradingView are either manual (you draw them yourself and they become stale as price evolves) or pivot-based (anchored to a fixed lookback period that may not match the swing you're actually looking at). This indicator takes a different approach: it uses the visible chart range as its context. It finds the highest high and lowest low within what you can currently see, determines trend direction based on which came first, and draws the full Fibonacci grid accordingly. When you scroll or zoom to a different area, the grid adapts — making it a dynamic analysis companion rather than a static drawing tool.
🔍 WHAT MAKES IT ORIGINAL
1. Visible-range swing detection. Instead of using a fixed pivot lookback or requiring manual anchor placement, the indicator scans the chart's visible window (chart.left_visible_bar_time to chart.right_visible_bar_time) to find the absolute high and low. This means the Fibonacci grid always reflects the swing structure you are currently analyzing. Zoom into a 50-bar range to see intraday retracements; zoom out to 500 bars to see the macro structure — the grid adjusts automatically. When the visible range changes (scroll or zoom), swing detection resets and recalculates.
2. Automatic trend direction from swing sequence. The indicator determines bullish or bearish bias by comparing when the swing low and swing high occurred. If the swing low formed first and the swing high formed later, the trend is classified as bullish (retracement levels are drawn down from the high, extensions project upward). If the swing high came first, the trend is bearish (retracement down from the low, extensions project downward). No manual input is needed — the grid orientation follows the price structure.
3. OTE Entry Zone + Target Zone as highlighted boxes. Two key zones are highlighted with semi-transparent boxes:
— Entry Zone (61.8%–78.6%) : the Optimal Trade Entry area from ICT/SMC methodology — the deep retracement zone where institutional re-entry is most likely
— Target Zone (−50% to −61.8%) : the extension zone where breakout moves frequently reach
Both zones have configurable colors and optional text labels ("ENTRY ZONE" / "TARGET ZONE") inside them. Zone-touch alerts fire when price enters either box for the first time.
4. Four labeled take-profit levels. TP labels are placed at key Fibonacci levels to provide a structured scale-out framework:
— TP1 at 38.2% (first retracement target — conservative exit)
— TP2 at 0% (full swing retest — swing high in uptrend, swing low in downtrend)
— TP3 at −27.2% (first Fibonacci extension)
— TP4 at −61.8% (deep extension — runner target)
Each TP level is only displayed if the corresponding Fibonacci line is enabled, keeping the chart clean.
5. 16 individually toggleable levels. The indicator supports a comprehensive set of levels: 0%, 23.6%, 38.2%, 50%, 61.8%, 70.6%, 78.6%, 100% (standard retracements), plus 18%, 150%, 200% (deep retracements), and −18%, −27.2%, −50%, −61.8%, −100% (extensions). Each level can be toggled on or off independently, so you can configure exactly the grid density you prefer — from a minimal 4-level setup to a full 16-level deep analysis.
⚙️ HOW IT WORKS
Swing detection:
On every bar, the script checks whether the current bar falls within the chart's visible time window (using chart.left_visible_bar_time and chart.right_visible_bar_time). Within this window, it tracks the highest high and lowest low, along with their bar indices. When the visible window changes (scroll/zoom), all swing data resets and recalculates from scratch. This ensures the grid always reflects your current view.
Trend direction:
If swingLowBarIdx < swingHighBarIdx (low came first), the trend is classified as bullish — Fibonacci levels count downward from the swing high (0% = high, 100% = low), and extensions project above the high. If the high came first, the trend is bearish — levels count upward from the swing low, extensions project below.
Level calculation:
Each Fibonacci level is calculated as: price = anchor ± (swingRange × ratio), where the anchor and direction depend on the trend bias. For a bullish trend: 0% = swingHigh, 61.8% = swingHigh − range × 0.618, −50% = swingHigh + range × 0.5. For bearish: mirrored.
Zone detection:
The Entry Zone (61.8%–78.6%) and Target Zone (−50% to −61.8%) are computed as price ranges. On each confirmed bar, the script checks if the close falls within either zone. A zone-touch alert fires on the first confirmed bar inside the zone (no repeated alerts while price stays in the zone). The inEntryZone / inTargetZone state resets when price leaves, allowing re-entry detection.
Drawing:
All visual elements (lines, labels, boxes) are drawn on barstate.islast and cleaned up on each redraw to prevent accumulation. Lines extend from 2 bars before the current bar to the label offset position. Zones use extend.right so they remain visible as new bars form.
📖 HOW TO USE
Reading the chart:
— Orange horizontal lines = Fibonacci levels (retracement + extensions)
— Optional % labels next to each line = level identification
— Gold semi-transparent box = Entry Zone (61.8%–78.6% OTE)
— Gold semi-transparent box with "TARGET ZONE" = extension target (−50% to −61.8%)
— TP1–TP4 labels = structured take-profit levels
— Optional diagonal line = swing connection (low-to-high or high-to-low)
Suggested workflow:
— Zoom to the swing you want to analyze — the grid adapts automatically
— In a bullish trend: look for buy entries when price retraces into the Entry Zone (61.8%–78.6%), with stop loss below 100% (swing low), targeting TP1 (38.2%) → TP2 (0% / swing high) → TP3 (−27.2%) → TP4 (−61.8%)
— In a bearish trend: look for sell entries when price retraces up into the Entry Zone, stop above swing high, targeting downward extensions
— Use the dashboard to confirm trend direction and monitor whether price is currently in the Entry or Target zone
— Set alerts for zone touches to get notified when price reaches OTE or target levels without watching the chart
Customization tips:
— For a clean chart: enable only 0%, 61.8%, 78.6%, 100%, −27.2%, −61.8% — this gives you the OTE boundaries, swing anchors, and two extension targets
— For deep analysis: enable all 16 levels to see the full Fibonacci structure
— Adjust Label Offset to move level labels further right if your chart is crowded
— Toggle Show Diagonal Swing Line to visually confirm which high/low pair is being used
⚙️ KEY SETTINGS REFERENCE
— Show All Elements (default On): master toggle for all Fibonacci visuals
— Line Width (default 1): thickness of Fibonacci lines (1 = subtle, 5 = bold)
— Line Style (default Dashed): solid, dashed, or dotted
— Label Offset (default 17 bars): how far right of the last bar to place labels
— Individual Levels : 16 toggleable levels from 200% to −100%
— Show Entry Zone (default On): highlight the 61.8%–78.6% OTE box
— Show Target Zone (default On): highlight the −50% to −61.8% extension box
— Show Text in Zones (default On): display "ENTRY ZONE" / "TARGET ZONE" labels
— Show TP Labels (default On): display TP1–TP4 at key levels
— Show Level % Labels (default Off): display percentage text next to each line
📊 Dashboard
The info panel displays:
— Trend direction (Bullish / Bearish) based on swing sequence
— Signal status (Entry Zone / Target Zone / —) when price enters a key zone
— Swing range in price units
— Current timeframe and indicator version
🔔 Alerts
Two alert conditions (each fires once per zone entry on bar close):
— Entry Zone touch : price closes inside the 61.8%–78.6% retracement zone
— Target Zone touch : price closes inside the −50% to −61.8% extension zone
Both support standard text and JSON webhook format.
⚠️ IMPORTANT NOTES
— This indicator anchors to the visible chart range — it recalculates when you scroll or zoom. This is a feature, not a bug: it lets you analyze any swing by simply framing it on your screen. However, it means the grid will change if you move the chart.
— Fibonacci levels are not predictive — they are reference points based on the measured swing range. Price may or may not react at any given level.
— The Entry Zone (61.8%–78.6%) is derived from the OTE concept used in ICT/SMC methodology. It represents a high-probability retracement area, but no retracement zone guarantees a reversal.
— Zone alerts require bar-close confirmation and fire once per entry — they do not repeat while price remains in the zone.
— Works across all asset classes and timeframes. No volume data required. 指標

RSI Fibonacci Analysis [UAlgo]RSI Fibonacci Analysis is an oscillator based Fibonacci mapping tool that projects Fibonacci ratios directly onto RSI swings instead of price swings. The script identifies meaningful pivot highs and pivot lows on RSI, draws a Fibonacci ladder between the most recent alternating swing pair, and then enriches each level with historical retest statistics. This approach aims to answer a practical question: when RSI transitions from one swing extreme to the next, which retracement ratios tend to attract RSI retests most often.
The indicator is built for clarity and repeatability. Swing points are detected using a pivot depth setting that confirms highs and lows only after a defined number of bars, reducing noise. A minimum bar gap filter ensures that the Fibonacci anchor points are not too close together. Once a new swing is confirmed, the script draws a connector line between anchors and plots the Fibonacci levels as horizontal lines across the swing window.
The distinguishing feature is the integrated statistics engine. Over a configurable lookback of past swing sequences, the script measures how often RSI retests each Fibonacci ratio within a tolerance band. It tracks bullish and bearish swing sequences separately, then shows level strength both on chart labels and in a compact dashboard table. The result is an RSI Fibonacci tool that is not only visual but also descriptive of historical behavior.
🔹 Features
1) RSI Centered Fibonacci Projection
Instead of projecting Fibonacci levels on price, the script projects Fibonacci ratios across RSI swing ranges. This can be useful for traders who treat RSI as a structure tool, where oscillator retracements and reactions often precede or confirm price continuation.
2) Pivot Based Swing Detection with Adjustable Depth
Swing highs and swing lows are detected on RSI using pivot logic. Swing Depth controls how many bars are required to confirm a pivot. Higher depth creates fewer swings and stronger anchors. Lower depth reacts faster but may produce more frequent levels.
3) Minimum Bar Gap Filter for Cleaner Anchors
A minimum distance in bars is enforced between the swing anchors used to draw the current Fibonacci. This avoids drawing ladders on very small micro swings and keeps levels meaningful.
4) Customizable Fibonacci Level Set
The script uses a standard Fibonacci set:
0, 0.236, 0.382, 0.5, 0.618, 0.786, 1
Each level is drawn as a horizontal line between the start and end swing timestamps, with an optional thickness adjustment based on statistical strength.
5) Level Strength Statistics with Bull and Bear Separation
A built in statistics engine scans historical swing triplets to identify valid zig zag sequences and measures whether the third swing retests near a Fibonacci ratio. Hits are counted separately for bullish swing ranges and bearish swing ranges, producing direction specific behavior profiles.
If enabled, the script appends a percent value to each level label, showing how often that level was retested relative to all counted hits for that direction.
6) Strength Weighted Line Thickness
When statistics are enabled, the script increases the line width of a Fibonacci level when it represents a larger share of total hits. This provides an at a glance read of which levels historically attract more retests.
7) RSI Gradient Coloring and Context Lines
The RSI plot uses a gradient scheme:
Above 50, the gradient shifts toward green as RSI approaches higher values
Below 50, the gradient shifts toward red as RSI approaches lower values
Overbought and oversold reference lines at 70 and 30 are also plotted for context.
8) Dashboard with Directional Hit Breakdown
A table dashboard can be displayed in a selectable corner of the chart. It lists each Fibonacci level along with:
Bull hits and bull percentage
Bear hits and bear percentage
Optional row highlighting emphasizes levels that exceed a threshold share of hits on either side, making dominant ratios easier to spot.
🔹 Calculations
1) RSI Computation and Visualization
RSI is calculated on a selectable source with a selectable length:
float rsiValue = ta.rsi(rsiSource, rsiLength)
A gradient color is applied based on whether RSI is above or below 50:
color rsiGradient =
rsiValue > 50
? color.from_gradient(rsiValue, 50, 80, color.new(color.green, 50), color.green)
: color.from_gradient(rsiValue, 20, 50, color.red, color.new(color.red, 50))
plot(rsiValue, "RSI", color=rsiGradient, linewidth=2)
Context lines:
hline(70, "Overbought", color=color.new(color.gray, 50), linestyle=hline.style_dotted)
hline(30, "Oversold", color=color.new(color.gray, 50), linestyle=hline.style_dotted)
2) RSI Swing Detection Using Pivots
Swings are detected using pivot highs and pivot lows on RSI:
float ph = ta.pivothigh(rsiValue, swingDepth, swingDepth)
float pl = ta.pivotlow(rsiValue, swingDepth, swingDepth)
When a pivot is confirmed, it is stored as a Swing object with price, bar index, and direction:
if not na(ph)
allSwings.unshift(Swing.new(ph, bar_index - swingDepth, true))
if not na(pl)
allSwings.unshift(Swing.new(pl, bar_index - swingDepth, false))
The swing list is capped to prevent excessive memory growth.
3) Fibonacci Levels and Current Fib Drawing
The script draws a Fibonacci ladder between the most recent pair of alternating swings, with a minimum bar gap condition:
Swing lastSwing = allSwings.get(0)
Swing prevSwing = allSwings.get(1)
if lastSwing.isHigh != prevSwing.isHigh
if math.abs(lastSwing.barIdx - prevSwing.barIdx) >= minBarGap
Swing start = prevSwing
Swing end = lastSwing
Levels are derived from the swing range:
float diff = end.price - start.price
float levelPrice = start.price + (diff * lvl.ratio)
A connector line between anchors is also drawn for visual context.
4) Historical Retest Statistics Engine
On each new confirmed swing, the script recomputes statistics over a lookback of past swings. It iterates through swing triplets:
sStart, sEnd define the fib range
sRetest is a later swing used to test retests
A valid pattern requires alternating swing types:
bool isValidPattern =
(sStart.isHigh != sEnd.isHigh) and (sEnd.isHigh != sRetest.isHigh)
For valid triplets, it computes the fib range and tests whether the retest swing is close to any fib level. The tolerance is 5 percent of the total range:
float lvlPrice = sStart.price + (fibRange * lvl.ratio)
float dist = math.abs(sRetest.price - lvlPrice)
if dist < (math.abs(fibRange) * 0.05)
if isBullish
lvl.hitsBull += 1
else
lvl.hitsBear += 1
Interpretation:
A hit is counted when a retest swing lands within the tolerance band around a Fibonacci ratio
Hits are accumulated separately for bullish ranges and bearish ranges
5) Strength Normalization and Label Percentages
When drawing the current fib, the script computes total hits for the current direction and converts each level’s hits into a percent:
int totalHits = 0
for lvl in levels
totalHits += isBullish ? lvl.hitsBull : lvl.hitsBear
int pct = int((hits / float(totalHits)) * 100)
labelText += " (" + str.tostring(pct) + "%)"
Line width is also increased when a level’s strength exceeds thresholds:
Strength greater than 20 percent increases width
Strength greater than 30 percent increases width further
6) Dashboard Totals and Percent Columns
On the last bar, the dashboard computes totals and level percentages separately for bull and bear hits:
int totalBull = 0
int totalBear = 0
for lvl in fibLevels
totalBull += lvl.hitsBull
totalBear += lvl.hitsBear
float pctBull = totalBull > 0 ? (lvl.hitsBull / float(totalBull)) * 100 : 0
float pctBear = totalBear > 0 ? (lvl.hitsBear / float(totalBear)) * 100 : 0
These values are printed in the table. Optional highlighting can be applied when either pctBull or pctBear exceeds a threshold, helping dominant levels stand out. 指標

GS Fibonacci Retracement Dynamic Anchor [Buy/Sell]GS Fibonacci Retracement Dynamic Anchor: Institutional Reversal Logic
The GS Fibonacci Retracement Dynamic Anchor is a high-precision Fibonacci tool designed for various assets including Stocks, Forex, and Options. Instead of static lines that become irrelevant as price moves, this script uses a rolling lookback engine to find the absolute Current Range . It then projects a "live grid" starting exactly from the highest and lowest bar indices.
How the Signals Work (Careful Entry):
This script does not just signal because a line was touched. It uses a Validation Phase :
The Pocket Entry: For a BUY signal, price must first dip into the "Golden Pocket" (below the 61.8% line). For a SELL signal, price must rise into the "Premium Pocket" (above 38.2%).
The Verification: The arrow only appears when the price closes back across the 50% Median Line . This confirms that the trend has truly shifted and the high/low is locked in.
Does this Redraw?
The Lines: Yes. The lines are Dynamic . If the market makes a higher high, the Fibonacci levels will automatically recalculate and shift up. This ensures you are always looking at the most current mathematical reality.
The Signals (Arrows): NO. The BUY and SELL arrows are calculated based on bar closes. Once an arrow appears on a closed candle, the logic is locked to that historical data.
Main Trading Applications:
Forex & Stocks: Ideal for catching "Mean Reversion." When a stock is overextended and enters the Premium Zone, the GS SELL signal helps you exit or short before the drop back to the median.
Options: The GS BUY signals represent "Deep Discount" entries where the Greeks (Delta/Theta) are most favorable for a bounce.
Equities/Funds: High-reliability signals for long-term investors to find "The Bottom" of a 75-day consolidation.
Key Features:
Institutional Ratios: Tracks the 21.0, 38.2, 50.0, 61.8, and 79.0 levels—the specific decimals used by automated trading algorithms.
Dynamic Anchor Dashboard: Real-time tracking of whether the price is in a "Premium" (Expensive) or "Discount" (Cheap) state.
Alert Ready: Fully integrated alert conditions for both Bullish and Bearish confirmations.
Points to Note:
Trend Strength: If the market is in a "Super Trend" (making new highs every 3 bars), the anchors will shift frequently. In these cases, wait for the price to stop making new anchors before trusting the 50% reclaim.
Lookback Setting: The 75-bar default is the "Sweet Spot" for most traders. Shortening it to 30 will make it a scalping tool; lengthening it to 200 will make it a macro-trend tool.
指標

Gann Sacred Geometry Hexagram Ver 1.2━━━━━━━━━━━━━━━━━━━━━━━━━━━━━━━━━━━━━━━━
🔯 GANN SACRED GEOMETRY HEXAGRAM v1.2
━━━━━━━━━━━━━━━━━━━━━━━━━━━━━━━━━━━━━━━━
A comprehensive technical analysis tool combining W.D. Gann's sacred geometry principles,
hexagram patterns, and advanced confluence scoring for high-probability trade signals.
━━━━━━━━━━━━━━━━━━━━━━━━━━━━━━━━━━━━━━━━
📖 GANN THEORY BACKGROUND
━━━━━━━━━━━━━━━━━━━━━━━━━━━━━━━━━━━━━━━━
W.D. Gann (1878-1955) believed markets move in geometric patterns and that price
and time must be in balance. His methods incorporated:
- The Square of Nine
- Geometric angles (1x1, 2x1, etc.)
- Sacred geometry and natural law
- Cycle theory and time divisions
- The principle "When time and price square, a change in trend is imminent"
This indicator applies these timeless principles with modern confluence analysis.
SACRED GEOMETRY FOUNDATION:
The hexagram (six-pointed star) is formed by two overlapping equilateral triangles:
- ▲ Upward triangle = Yang energy, bullish forces, expansion
- ▼ Downward triangle = Yin energy, bearish forces, contraction
When overlapped, they create the "Star of David" - representing perfect balance
between opposing market forces. Gann believed this geometry revealed natural
support and resistance zones where price would react.
HEXAGRAM IN MARKETS:
- 6 outer points = Major reversal zones
- Center point = Balance/equilibrium price
- Inner intersections = Secondary support/resistance
- The shape itself creates "harmonic" price levels
GANN'S SQUARE PHILOSOPHY:
"When time and price square, a change in trend is imminent."
- W.D. Gann
This indicator applies the "squaring" concept:
1. SPATIAL SQUARE: Grid cells are perfect squares in price-time space
2. TEMPORAL SQUARE: Time divisions (1/4, 1/2, 3/4) create cycle points
3. PRICE SQUARE: Price divisions (25%, 50%, 75%) mirror time divisions
4. GEOMETRIC SQUARE: All geometry radiates from perfect square centers
When price reaches a corner or edge of a square at a time cycle point,
the "squaring" of price and time creates a reversal probability zone.
PHI IN GANN GEOMETRY:
The Golden Ratio appears throughout natural phenomena and market structure.
This script uses φ in two primary ways:
1. INNER TRIANGLE SCALING:
- Outer triangles span the full cell (100%)
- Inner triangles scaled by φ⁻¹ (0.618 or 61.8%)
- This creates Fibonacci retracement levels geometrically
2. HARMONIC RESONANCE:
- φ ratio divides price space into natural harmony
- Markets tend to pause/reverse at these φ-scaled levels
- Combines Fibonacci analysis with Gann geometry
MATHEMATICAL RELATIONSHIP:
Inner Triangle Height = Outer Height × 0.618
Inner Triangle Width = Outer Width × 0.618
These create the 61.8% retracement levels automatically
within each grid cell's geometry.
GANN'S COMPLETE ANGLE SYSTEM:
Gann identified 9 primary angles that price follows. Each represents a different
relationship between price movement and time passage:
╔════════════════════════════════════════════════════════════════╗
║ ANGLE │ RATIO │ DEGREES │ MEANING ║
╠════════════════════════════════════════════════════════════════╣
║ 1x8 │ 1:8 │ 7.125° │ Very slow trend (gentle) ║
║ 1x4 │ 1:4 │ 14.036° │ Slow trend ║
║ 1x3 │ 1:3 │ 18.435° │ Moderate-slow trend ║
║ 1x2 │ 1:2 │ 26.565° │ Moderate trend ║
║ 1x1 │ 1:1 │ 45.000° │ MASTER ANGLE (most important) ║
║ 2x1 │ 2:1 │ 63.435° │ Strong trend ║
║ 3x1 │ 3:1 │ 71.565° │ Very strong trend ║
║ 4x1 │ 4:1 │ 75.964° │ Extreme trend ║
║ 8x1 │ 8:1 │ 82.875° │ Parabolic trend (unsustainable)║
╚════════════════════════════════════════════════════════════════╝
THE 1x1 ANGLE - THE MASTER:
- Most important angle in Gann theory
- Represents perfect balance: 1 unit price = 1 unit time
- When price is ABOVE 1x1 = Bullish control
- When price is BELOW 1x1 = Bearish control
- Crossing 1x1 = Major trend change signal
ANGLE FANS:
- From any pivot point, all 9 angles radiate outward
- Creates a "fan" of dynamic support/resistance
- Steeper angles (4x1, 8x1) = strong momentum resistance
- Gentler angles (1x4, 1x8) = weak support in downtrends
THE SACRED DIVISIONS OF TIME:
Gann divided all cycles into 8 equal parts, based on ancient geometry
and astrological principles:
CYCLE DIVISIONS (8ths):
┌─────────────────────────────────────────────────────┐
│ 1/8 = 12.5% │ First minor turn point │
│ 2/8 = 25.0% │ First major turn (Cardinal) │
│ 3/8 = 37.5% │ Second minor turn │
│ 4/8 = 50.0% │ MID-CYCLE (most powerful) │
│ 5/8 = 62.5% │ Third minor turn │
│ 6/8 = 75.0% │ Second major turn (Cardinal) │
│ 7/8 = 87.5% │ Fourth minor turn │
│ 8/8 = 100.0% │ CYCLE COMPLETION (reversal zone) │
└─────────────────────────────────────────────────────┘
WHY EIGHTHS?
- 8 is the number of balance in sacred geometry
- Octave divisions create harmonic resonance
- 360° circle ÷ 8 = 45° (the 1x1 master angle)
- Natural cycles show 8-fold symmetry
IN THIS SCRIPT:
When current time position is within 8% of any eighth division,
the "Gann 8ths Timing" factor activates, adding confluence points.
THE CARDINAL CROSS SYSTEM:
The Cardinal Cross divides any square into four equal quadrants,
creating a cross pattern:
100% ●━━━━━━━━━━━━━●
┃ ↑ ┃
75% ┃ SELL ZONE ┃ ← Resistance quadrant
┃ ↑ ┃
50% ●━━━━━●━━━━━━● ← EQUILIBRIUM (most important)
┃ ↓ ┃
25% ┃ BUY ZONE ┃ ← Support quadrant
┃ ↓ ┃
0% ●━━━━━━━━━━━━━●
PRICE LEVELS:
- 0% = Bottom support (grid cell low)
- 25% = Lower mid-level support
- 50% = PERFECT BALANCE - most powerful level
- 75% = Upper mid-level resistance
- 100% = Top resistance (grid cell high)
TIME DIVISIONS:
- 0% = Cycle start (grid cell left edge)
- 25% = First quarter turn
- 50% = Mid-cycle (most powerful timing)
- 75% = Third quarter turn
- 100% = Cycle completion (grid cell right edge)
CONFLUENCE MAGIC:
When BOTH price AND time align at cardinal points simultaneously:
Example: Price at 50% level + Time at 50% of cycle = Maximum power
This is the "squaring" Gann referred to.
━━━━━━━━━━━━━━━━━━━━━━━━━━━━━━━━━━━━━━━━
📊 KEY FEATURES
━━━━━━━━━━━━━━━━━━━━━━━━━━━━━━━━━━━━━━━━
✅ Dynamic Grid System (1x1 to 7x7) - Automatically constructed from swing high to swing low
✅ Sacred Geometry Hexagrams - Overlapping triangles creating Star of David pattern
✅ Golden Ratio (φ = 1.618) Inner Triangles - Fibonacci harmony in geometry
✅ 9 Complete Gann Angles - 1x1, 2x1, 1x2, 3x1, 1x3, 4x1, 1x4, 8x1, 1x8
✅ Cardinal Cross Levels - 0%, 25%, 50%, 75%, 100% price divisions
✅ Gann 8ths Timing Cycles - 1/8, 1/4, 3/8, 1/2, 5/8, 3/4, 7/8 time divisions
✅ Price-Time Square Balance - Gann's principle of harmonious price-time relationship
✅ Advanced Confluence Scoring - Multi-factor signal validation (8-30 score range)
✅ Optimized Geometry Display - Shows full detail only near current price (reduces clutter)
✅ Customizable Visual Themes - Full color and thickness control
━━━━━━━━━━━━━━━━━━━━━━━━━━━━━━━━━━━━━━━━
🎯 HOW IT WORKS
━━━━━━━━━━━━━━━━━━━━━━━━━━━━━━━━━━━━━━━━
📍 GRID CONSTRUCTION:
The indicator identifies the most recent significant swing high-to-low movement using
configurable pivot periods (default: 88 bars). This creates the base "square" which is
then replicated in a grid pattern both vertically (price) and horizontally (time).
📐 SACRED GEOMETRY:
Each grid cell contains:
- Outer hexagram (Star of David) formed by two overlapping triangles
- Inner φ-ratio triangles scaled by the Golden Ratio
- Gann angles radiating from the center point
- Cardinal cross levels dividing price into quarters
🔍 CONFLUENCE SCORING SYSTEM:
Signals are generated when multiple Gann principles align:
1. Cardinal Cross Levels (0-6 points) - Price at key quarter divisions
2. Gann Angle Touches (0-5 points) - Price touching dynamic support/resistance angles
3. Angle Clustering (0-6 points) - Multiple angles converging = strong zone
4. Gann 8ths Timing (0-3 points) - At critical time cycle points
5. Price-Time Square (0-4 points) - Balanced price/time movement
6. Trend Alignment (0-3 points) - Signal direction matches trend
7. Grid Boundary Timing (0-3 points) - Near cell edges = reversal zones
8. φ Triangle Touches (0-2 points) - Golden ratio support/resistance
9. Reversal Patterns (0-2 points) - Wick rejections confirming reversal
Minimum confluence score of 15 required for signal (adjustable 8-30).
━━━━━━━━━━━━━━━━━━━━━━━━━━━━━━━━━━━━━━━━
⚙️ RECOMMENDED SETTINGS
━━━━━━━━━━━━━━━━━━━━━━━━━━━━━━━━━━━━━━━━
📊 For Daily Charts (Swing Trading):
- Gann Number: 88
- Grid Size: 4x4
- Confluence Score: 15
- Geometry Range: 5
- Trend Filter: ON
📊 For 4H Charts (Intraday):
- Gann Number: 44
- Grid Size: 3x3
- Confluence Score: 12-13
- Geometry Range: 3-4
- Trend Filter: ON
📊 For 15M Charts (Scalping):
- Gann Number: 22
- Grid Size: 2x2
- Confluence Score: 10-12
- Geometry Range: 2-3
- Allow Counter-Trend: Consider enabling
━━━━━━━━━━━━━━━━━━━━━━━━━━━━━━━━━━━━━━━━
📚 BEST PRACTICES
━━━━━━━━━━━━━━━━━━━━━━━━━━━━━━━━━━━━━━━━
✓ Use higher confluence scores (15+) for higher probability trades
✓ Combine with volume analysis for confirmation
✓ Respect trend filter - signals with trend are stronger
✓ Watch for signals at grid boundaries (time cycle completions)
✓ Higher scores (20+) indicate exceptional setups
✓ Use alerts to catch signals in real-time
✓ Works best on liquid markets with clear swings
EXAMPLE 1: Strong Buy Signal (Score: 18)
✓ Price touched 50% level (6 pts)
✓ 1x1 Gann angle support (5 pts)
✓ At Gann 8th cycle point (3 pts)
✓ Price-Time squared (4 pts)
= High probability long entry
EXAMPLE 2: Medium Sell Signal (Score: 15)
✓ Price at 75% level (4 pts)
✓ 2x1 angle resistance (3 pts)
✓ Trend aligned downward (3 pts)
✓ Near grid boundary (3 pts)
✓ Bearish wick rejection (2 pts)
= Valid short entry
━━━━━━━━━━━━━━━━━━━━━━━━━━━━━━━━━━━━━━━━
🎨 CUSTOMIZATION OPTIONS
━━━━━━━━━━━━━━━━━━━━━━━━━━━━━━━━━━━━━━━━
- Structure: Gann Number (11, 22, 44, 88, 176, 352)
- Grid: Size from 1x1 to 7x7
- Geometry: Toggle squares, triangles, angles, levels
- Optimization: Show geometry only near price (performance boost)
- Thickness: All line widths adjustable (1-5)
- Colors: Full color customization for all elements
- Scoring: Adjust all tolerance and threshold parameters
- Timing: Enable/disable Gann 8ths, Price-Time Square
- Filters: Trend filter, boundary requirement, counter-trend signals
- Display: 4 signal styles (Labels, Diamonds, Circles, Stars)
━━━━━━━━━━━━━━━━━━━━━━━━━━━━━━━━━━━━━━━━
⚠️ IMPORTANT NOTES
━━━━━━━━━━━━━━━━━━━━━━━━━━━━━━━━━━━━━━━━
- This indicator is for educational purposes
- Not financial advice - always do your own research
- Past performance does not guarantee future results
- Use proper risk management and position sizing
- Combine with other analysis methods for best results
- Grid redraws when new swing high/low forms
- Signals appear in real-time based on confluence scoring
━━━━━━━━━━━━━━━━━━━━━━━━━━━━━━━━━━━━━━━━
📞 SUPPORT & UPDATES
━━━━━━━━━━━━━━━━━━━━━━━━━━━━━━━━━━━━━━━━
Follow for updates and improvements. Feedback welcome!
Version 1.2 - January 2025
- Optimized geometry rendering
- Enhanced confluence scoring
- Improved visual clarity
- Performance optimizations
━━━━━━━━━━━━━━━━━━━━━━━━━━━━━━━━━━━━━━━━ 指標

Golden Zone Structure [Kodexius]Golden Zone Structure is a ZigZag based market structure and Fibonacci tool designed to make swing context easier to read directly on the price chart. It detects meaningful pivot highs and lows, labels the evolving structure (HH, HL, LH, LL, including equal highs and lows), and automatically projects a Fibonacci map across the most recent completed swing.
Instead of forcing you to manually anchor Fib tools after every new leg, the script rebuilds levels each time a fresh pivot is confirmed. This makes it well suited for traders who focus on swing continuation, pullback depth, and reaction zones where liquidity and orderflow often concentrate.
A key emphasis is the Golden Zone highlight. The indicator shades the zone that is most relevant to the current swing context so you can quickly spot where a retracement is approaching a higher probability reaction area, without cluttering the chart with too many permanent objects.
The tool is intentionally visual and configurable. You can choose pivot source (High/Low or Close), adjust swing sensitivity via ZigZag period, switch color themes, and decide how much detail you want on screen (levels, zigzag lines, labels).
Optional trading markers can be enabled for users who want a lightweight “zone interaction” prompt. These markers are not intended as a standalone trading system. They are meant to complement your own confirmation rules (structure alignment, volume, higher timeframe bias, or price action triggers).
🔹Features
🔸 ZigZag Swing Engine
- Uses a configurable ZigZag period to filter noise and confirm swing points only when the lookback logic validates the move.
Supports different pivot sources (High/Low or Close) so you can choose between cleaner structure or more reactive behavior depending on the instrument.
Optional ZigZag leg drawing to visualize swing flow without clutter.
🔸 Market Structure Labels (HH, HL, LH, LL + Equals)
- Automatically labels each confirmed pivot based on how it compares to the prior pivot of the same type.
High side classification: H, HH, LH, EH.
Low side classification: L, HL, LL, EL.
Equal highs and lows help reveal potential liquidity pools and “magnet” areas where price often reacts or breaks with intent.
🔸 Auto Fibonacci Map on the Active Swing
- Rebuilds Fibonacci levels every time a new pivot is confirmed, keeping the projection aligned with the most recent completed leg.
Core retracement levels: 0.236, 0.382, 0.500, 0.618, 0.786.
Extension levels: 1.272 and 1.618 for expansion targeting and continuation mapping.
Optional price labels on each level, formatted to tick size so levels remain readable across markets.
🔸 Golden Zone Highlighting (Context Aware)
- Highlights the most relevant retracement band with a soft fill so you can spot “zone approach” moments at a glance.
The zone selection adapts to swing context, focusing on a different retracement region depending on whether the last confirmed pivot is a peak or a trough.
Adjustable transparency keeps the chart clean while preserving the key reaction area.
🔸 Visual Customization + Themes
- Multiple color themes (Neon, Ocean, Sunset, Monochrome) so the tool fits different chart styles and backgrounds.
Independent toggles for Fib levels, Golden Zone shading, ZigZag lines, and price labels.
Line width controls for better scaling across timeframes.
🔸 Optional Trading Markers + Alerts
- Optional BUY and SELL labels based on zone interaction logic with candle confirmation filters.
ATR based placement offset scaled by sensitivity so labels stay visually separated during volatility.
Built in alert conditions for new pivot highs and new pivot lows so you can monitor structure changes without watching every bar.
▶ Practical Usage Tip
• Use structure labels to define bias (HH + HL for bullish structure, LH + LL for bearish structure).
• Use the Golden Zone as a location filter, then wait for your own trigger (break of minor structure, rejection candle, volume shift, etc.).
• Treat extensions as “map points” not guaranteed targets. They work best when structure supports continuation. 指標

Metallic Retracement LevelsThere's something that's always bothered me about how traders use Fibonacci retracements. Everyone treats the golden ratio like it's the only game in town, but mathematically speaking, it's completely arbitrary. The golden ratio is just the first member of an infinite family of metallic means, and there's no particular reason why 1.618 should be special for markets when we have the silver ratio at 2.414, the bronze ratio at 3.303, and literally every other metallic mean extending to infinity. We just picked one and decided it was magical.
The metallic means are a sequence of mathematical constants that generalize the golden ratio. They're defined by the equation x² = kx + 1, where k is any positive integer. When k equals 1, you get the golden ratio. When k equals 2, you get the silver ratio. When k equals 3, you get bronze, and so on forever. Each metallic mean generates its own set of ratios through successive powers, just like how the golden ratio gives you 0.618, 0.382, 0.236 and so forth. The silver ratio produces a completely different set of retracement levels, as does bronze, as does any arbitrary metallic number you want to choose.
This indicator calculates these metallic means using the standard alpha and beta formulas. For any metallic number k, alpha equals (k + sqrt(k² + 4)) / 2, and we generate retracement ratios by raising alpha to various negative powers. The script algorithmically generates these levels instead of hardcoding them, which is how it should have been done from the start. It's genuinely silly that most fib tools just hardcode the ratios when the math to generate them is straightforward. Even worse, traditional fib retracements use 0.5 as a level, which isn't even a fibonacci ratio. It's just thrown in there because it seems like it should be important.
The indicator works by first detecting swing points using the Sylvain Zig-Zag . The zig-zag identifies significant price swings by combining percentage change with ATR adjustments, filtering out noise and connecting major pivot points. This is what drives the retracement levels. Once a new swing is confirmed, the script calculates the range between the last two pivot points and generates metallic retracement levels from the most recent swing low or high.
You can adjust which metallic number to use (golden, silver, bronze, or any positive integer), control how many power ratios to display above and below the 1.0 level, and set how many complete retracement cycles you want drawn. The levels extend from the swing point and show you where price might react based on whichever metallic mean you've selected. The zig-zag settings let you tune the sensitivity of swing detection through ATR period, ATR multiplier, percentage reversal, and additional absolute or tick-based reversal values.
What this really demonstrates is that retracement analysis is more flexible than most traders realize. There's no mathematical law that says markets must respect the golden ratio over any other metallic mean. They're all valid mathematical constructs with the same kind of recursive properties. By making this tool, I wanted to highlight that using fibonacci retracements involves an arbitrary choice, and maybe that choice should be more deliberate or at least tested against alternatives. You can experiment with different metallic numbers and see which ones seem to work better for your particular market or timeframe, or just use this to understand that the standard fib levels everyone uses aren't as fundamental as they appear. 指標

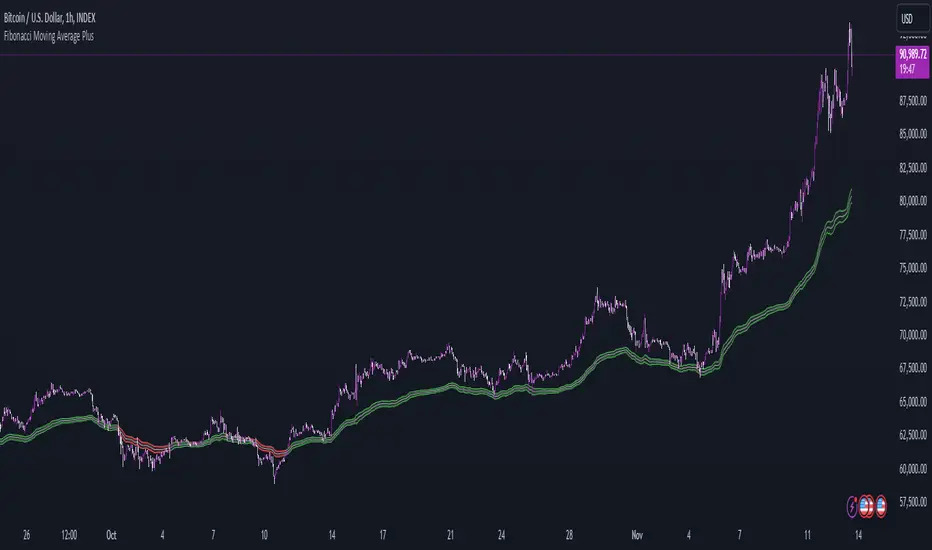
Fibonacci Moving Average PlusFibonacci Moving Average Plus is a sophisticated technical indicator that employs the first 15 numbers of the Fibonacci sequence to create dynamic moving average channels. This indicator aims to capture both immediate and long-term price movements by calculating Exponential Moving Averages (EMAs) based on these Fibonacci values. By using Fibonacci-based moving averages for both high and low price points, the indicator generates a visual channel that reflects the ebb and flow of market trends, acting as potential zones of support and resistance. Additionally, the indicator provides midline, retracement, and extension levels rooted in Fibonacci ratios, which are frequently observed as key levels for reversals or trend continuation.
Ideology Behind Using Fibonacci Sequence-Based Moving Averages
The Fibonacci sequence, known for its mathematical harmony and prevalence in natural patterns, is widely utilized in technical analysis to identify potential turning points in markets. In this indicator, the first 15 Fibonacci numbers (5, 8, 13, 21, etc.) are used as the lookback periods for EMAs to capture different layers of market sentiment. These moving averages represent timeframes that are theoretically in alignment with the natural rhythms of market cycles, where key levels—often coinciding with Fibonacci numbers—can act as magnetic points for price.
The Fibonacci high and low channels aim to encapsulate price action, giving traders a sense of whether the market is trending, consolidating, or experiencing reversal pressure. These levels, grounded in both mathematics and market psychology, help traders spot areas where price might face resistance or find support.
Key Features
Fibonacci Moving Average High and Low: This indicator calculates the high and low EMAs based on Fibonacci sequence numbers (e.g., 5, 8, 13, etc.) for enhanced trend analysis.
Golden Pocket Retracement (GPR) and Extension (GPE) Bands: Displays common Fibonacci retracement and extension levels (0.618, 0.65 for retracement, and 1.618, 1.65 for extension).
Midline: Plots the average of the Fibonacci high and low to act as an additional reference level.
Stop-Loss Levels: Provides suggested stop-loss levels based on Fibonacci levels for both long and short positions.
Basic User Guide
Adjust Input Settings:
Input Timeframe: Set a specific timeframe for the Fibonacci moving average calculation, separate from the chart's primary timeframe.
Show Fibonacci MA High/Low: Toggle the visibility of the high and low Fibonacci moving averages.
Show Mid Line: Display a midline for added trend reference.
Show Golden Pocket Bands: Choose to display retracement or extension bands for potential support or resistance zones.
Show Stop-Loss Levels: Enable to visualize potential stop-loss levels for both long and short trades.
Interpretation:
Fibonacci MA High and Low: Use these lines to gauge the general trend. When the price is above both, it may indicate an uptrend; below both, a downtrend.
Golden Pocket Retracement: This zone (between 0.618 and 0.65) is often a key level for potential reversals or support/resistance.
Golden Pocket Extension: The 1.618 and 1.65 levels can indicate potential profit-taking or trend exhaustion points.
Stop-Loss Levels: The calculated stop-loss levels (long SL below and short SL above) can aid in risk management.
Customization:
You can customize the appearance and visibility of each component through the input settings to fit your specific strategy and visual preferences.
This indicator should be used alongside other technical analysis tools to provide a more comprehensive trading approach.
This Indicator would not exist without the original contributions and blessing from Sofien Kaabar 指標

指標

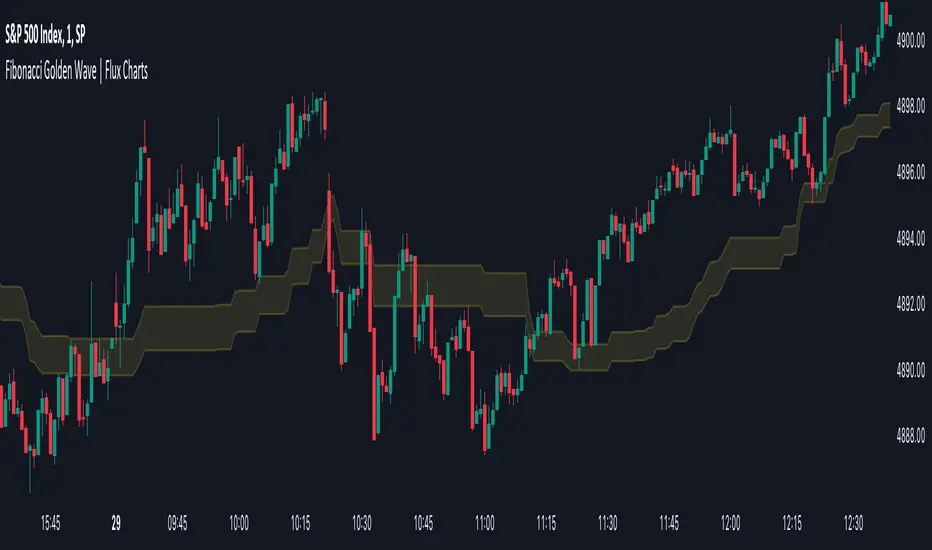
Fibonacci Golden Wave | Flux Charts💎 GENERAL OVERVIEW
Introducing the new Fibonacci Golden Wave indicator! This indicator plots the Fibonacci golden zone from the last highs / lows instead of the pivots so that the resulting zone is shaped like a "wave". We believe this will help you to see the latest trend of the Fibonacci retracement levels easier. For more information of the working progress of the indicator, check the "How Does It Work" section of the description.
Features of the new Fibonacci Golden Wave Indicator :
Plots Fibonacci Golden Zone Based On Highs / Lows
A Different Approach To Fibonacci Retracement Levels
Customizable Swing Range & Retracement Levels
Customizable Visuals
🚩UNIQUENESS
The Fibonacci Golden Zone is a widely used concept in trading. To achieve the golden zone, the Fibonacci retracement levels are generally placed between pivot high / lows, resulting in a rectangular zone. However, this indicator will place the Fibonacci retracement levels between the last highest / lowest points going back from the current bar, resulting in a "wave" shape. This will help traders understand the latest trend of the Fibonacci golden zone. The ability to change the Fibonacci retracement levels to your liking in the settings is another unique function of this indicator.
📌 HOW DOES IT WORK ?
To calculate the Fibonacci wave, first of all we need to place a line at the lowest low and the highest high of the last 20 bars (can be changed from the settings)
Then, Fibonacci retracement levels are placed between those lines.
For the next step, put two points in the (1.0 - 0.618) = 0.382 and (1.0 - 0.5) = 0.5 (can be changed from the settings) levels of the Fibonacci retracement.
Repeat this step for each bar in the chart, then connect all the points.
Instead of a pivot approach to the Fibonacci retracement levels, this approach will not need a new pivot point to form before calculating the new Fibonacci golden zone, thus indicating the latest trend of the current golden zone.
🚨HOW YOU CAN USE THIS INDICATOR
Fibonacci retracement tool is typically used to find entries after a pullback in an uptrend or downtrend. The Fibonacci Golden Wave can be used in the same way. It can be used to find entries after markets retrace. In this example, the Fibonacci Golden Wave is able to catch 2 pullback opportunities to enter long in the market with the trend.
⚙️SETTINGS
1. General Configuration
Swing Range -> This setting determines how the highest high / lowest low levels are calculated. This essentially means that the script will look back X bars before the current bar in calculation to find the highest / lowest wick points.
2. Golden Zone
Here you can select which range of the Fibonacci retracement levels should be considered as the golden zone. The default value is 0.5 - 0.618. 指標
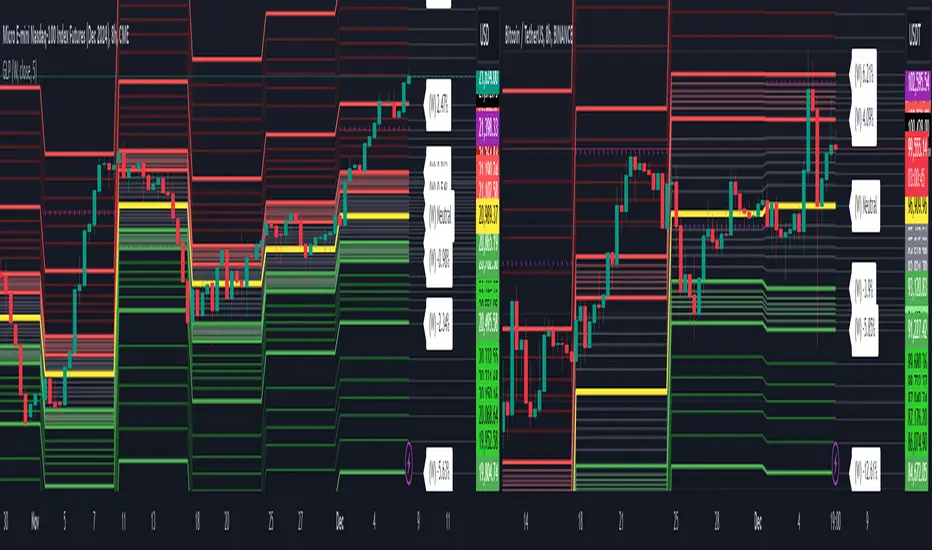
Golden Level Predictions v1.0Golden Level Predictions (GLP) Trading Indicator
This script introduces a custom trading indicator named "GLP" tailored for the TradingView platform. It offers various price levels derived from Fibonacci calculations and other mathematical models, assisting traders in pinpointing potential overpriced and discounted price levels.
Key Features:
User Inputs : Users have the flexibility to select their desired timeframe, with options ranging from Weekly, Daily, Monthly, and more. Additionally, they can opt to showcase Fibonacci lines and the associated prices within these levels.
Price Level Calculations :
- Employs constants such as the Golden Ratio (PHI) and Pi (PI) to extract various multipliers and factors.
- Assesses if the current asset is a cryptocurrency and tweaks calculations accordingly.
- Determines overpriced and discounted price levels, drawing from the current open price and past data.
Fibonacci Levels :
- For each overpriced and discounted level, the script computes intermediary Fibonacci levels, including 23.6%, 38.2%, 50%, 61.8%, and 78.6% (the 3rd level is excluded due to plot limitations).
- These levels are illustrated on the chart, granting traders a more detailed view of price targets.
Visual Elements :
- Projects horizontal lines to the subsequent selected indicator interval for every calculated price level.
- Exhibits potential percentage gains or losses at each tier, indicating the prospective price alteration upon reaching that level.
- Differentiates overpriced (green) and discounted (red) levels using color codes. A neutral price is depicted in yellow.
Anticipated Close Calculation : Offers a projected closing price for the current timeframe, based on a myriad of factors.
This indicator is particularly effective with cryptocurrencies due to their inherent volatility. It's also compatible with stocks and is most efficient with tickers that provide volume data.
指標

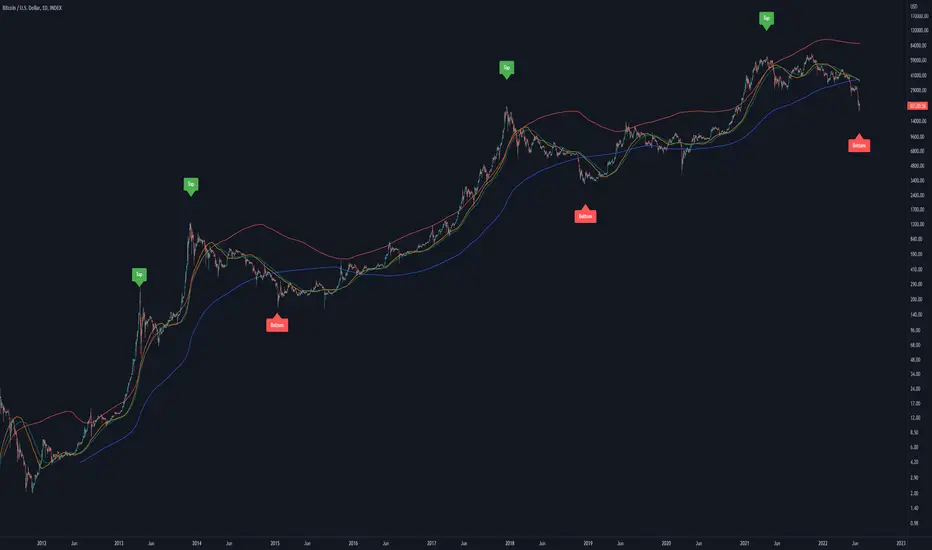
Bitcoin Golden Pi CyclesTops are signaled by the fast top MA crossing above the slow top MA, and bottoms are signaled by the slow bottom MA crossing above the fast bottom MA. Alerts can be set on top and bottom prints. Does not repaint.
Similar to the work of Philip Swift regarding the Bitcoin Pi Cycle Top, I’ve recently come across a similar mathematically curious ratio that corresponds to Bitcoin cycle bottoms. This ratio was extracted from skirmantas’ Bitcoin Super Cycle indicator . Cycle bottoms are signaled when the 700D SMA crosses above the 137D SMA (because this indicator is closed source, these moving averages were reverse-engineered). Such crossings have historically coincided with the January 2015 and December 2018 bottoms. Also, although yet to be confirmed as a bottom, a cross occurred June 19, 2022 (two days prior to this article)
The original pi cycle uses the doubled 350D SMA and the 111D SMA . As pointed out this gives the original pi cycle top ratio:
350/111 = 3.1532 ≈ π
Also, as noted by Swift, 111 is the best integer for dividing 350 to approximate π. What is mathematically interesting about skirmanta’s ratio?
700/138 = 5.1095
After playing around with this for a while I realized that 5.11 is very close to the product of the two most numerologically significant geometrical constants, π and the golden ratio, ϕ:
πϕ = 5.0832
However, 138 turns out to be the best integer denominator to approximate πϕ:
700/138 = 5.0725 ≈ πϕ
This is what I’ve dubbed the Bitcoin Golden Pi Bottom Ratio.
In the spirit of numerology I must mention that 137 does have some things going for it: it’s a prime number and is very famously almost exactly the reciprocal of the fine structure constant (α is within 0.03% of 1/137).
Now why 350 and 700 and not say 360 and 720? After all, 360 is obviously much more numerologically significant than 350, which is proven by the fact that 360 has its own wikipedia page, and 350 does not! Using 360/115 and 720/142, which are also approximations of π and πϕ respectively, this also calls cycle tops and bottoms.
There are infinitely many such ratios that could work to approximate π and πϕ (although there are a finite number whose daily moving averages are defined). Further analysis is needed to find the range(s) of numerators (the numerator determines the denominator when maintaining the ratio) that correctly produce bottom and top signals. 指標
指標

指標

Pythagorean Means of Moving AveragesDESCRIPTION
Pythagorean Means of Moving Averages
1. Calculates a set of moving averages for high, low, close, open and typical prices, each at multiple periods.
Period values follow the Fibonacci sequence.
The "short" set includes moving average having the following periods: 5, 8, 13, 21, 34, 55, 89, 144, 233, 377.
The "mid" set includes moving average having the following periods: 5, 8, 13, 21, 34, 55, 89, 144, 233, 377, 610, 987, 1597.
The "long" set includes moving average having the following periods: 5, 8, 13, 21, 34, 55, 89, 144, 233, 377, 610, 987, 1597, 2584, 4181.
2. User selects the type of moving average: SMA, EMA, HMA, RMA, WMA, VWMA.
3. Calculates the mean of each set of moving averages.
4. User selects the type of mean to be calculated: 1) arithmetic, 2) geometric, 3) harmonic, 4) quadratic, 5) cubic. Multiple mean calculations may be displayed simultaneously, allowing for comparison.
5. Plots the mean for high, low, close, open, and typical prices.
6. User selects which plots to display: 1) high and low prices, 2) close prices, 3) open prices, and/or 4) typical prices.
7. Calculates and plots a vertical deviation from an origin mean--the mean from which the deviation is measured.
8. Deviation = origin mean x a x b^(x/y)/c.
9. User selects the deviation origin mean: 1) high and low prices plot, 2) close prices plot, or 3) typical prices plot.
10. User defines deviation variables a, b, c, x and y.
Examples of deviation:
a) Percent of the mean = 1.414213562 = 2^(1/2) = Pythagoras's constant (default).
b) Percent of the mean = 0.7071067812 = = = sin 45˚ = cos 45˚.
11. Displaces the plots horizontally +/- by a user defined number of periods.
PURPOSE
1. Identify price trends and potential levels of support and resistance.
CREDITS
1. "Fibonacci Moving Average" by Sofien Kaabar: two plots, each an arithmetic mean of EMAs of 1) high prices and 2) low prices, with periods 5, 8, 13, 21, 34, 55, 89, 144, 233, 377, 610, 987, 1597, 2584, 4181.
2. "Solarized" color scheme by Ethan Schoonover. 指標

指標

指標

Euler Cubes - CubᵋI give you the "Euler Cubes", inspired by the mathematical number 'e' (Euler's number).
It is suggested (fibonacci ratios analogy) that price/e ratio can give Support/Resistance area's.
The first cube is made by a low/high of choice, for example:
You set the 'source low'/'source high' in position:
Then you choose the 'e ratio' (x times 'e')
This multiplies the distance 'high-low' times '0.271828' times 'the set number' .
For example, choosing 5 gives 5 x 0.271828 = 1.35914, the distance 'high-low' hereby multiplied by 1.35914, the following cubes multiply the previous distance by 1.35914.
(Settings below 5 will give cubes smaller than the 'high-low' distance)
In the case of x times 'e' = 5:
You can extend the lines:
Now you can give it an angle:
Do mind, using it over very little bars and using an angle can cause some lines to not align as intended, because for now, it is not possible to plot in between bars.
There are also 'Euler' SMA and EMA available with following length's:
27, 54, 82,109, 136, 163, 190 and 217
Cheers!
指標

指標

指標

Golden Ratio MultiplesI call this "Phi Ribbons." The Golden Ratio, also known as Phi, is fantastic at predicting areas of price reversal.
Every moving average is a fibonacci multiple of the base function 355 SMA .
The rainbow above is an array of fibonacci multiples that are greater than one (1.618, 2, 2.618, 3, 5, 8, 13, 21)
The rainbow below is an array of fibonacci multiples that are less than one (0.786, 0.618, 0.5, 0.382, 0.236, 0.14)
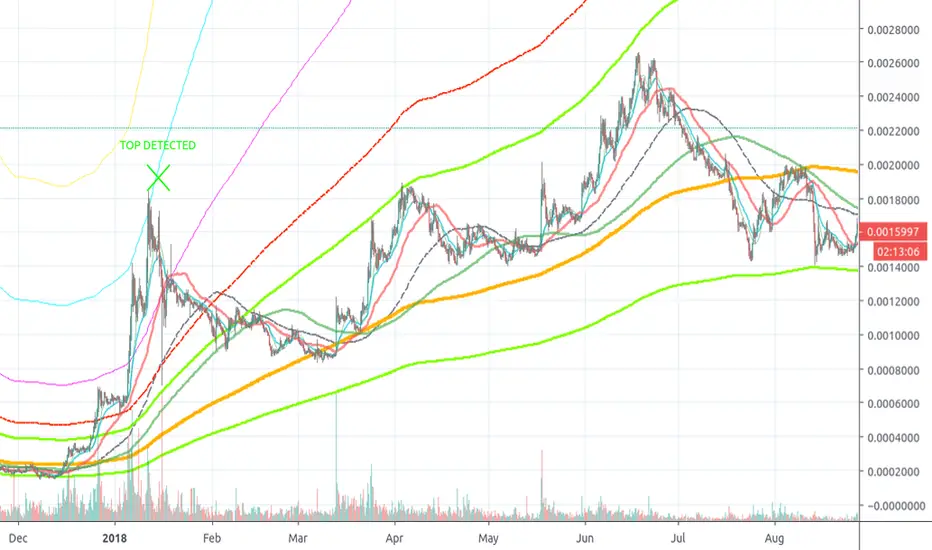
Notice the precision of marking areas of potential price reversals
EASTER EGG: The two moving averages at the top of the script are 355 SMA & 113 SMA . This is one of the lowest ratios that closely approximates Pi (3.14159).
Simply plotting the 133 SMA will add a unique feature:
355/133 = 3.14159
When the 113 crosses below the 355 it tends to mark the end of major bullish impulses, and a crossover is a bullish sign. 指標