OPEN-SOURCE SCRIPT
UCSgears_Linear Regression Slope
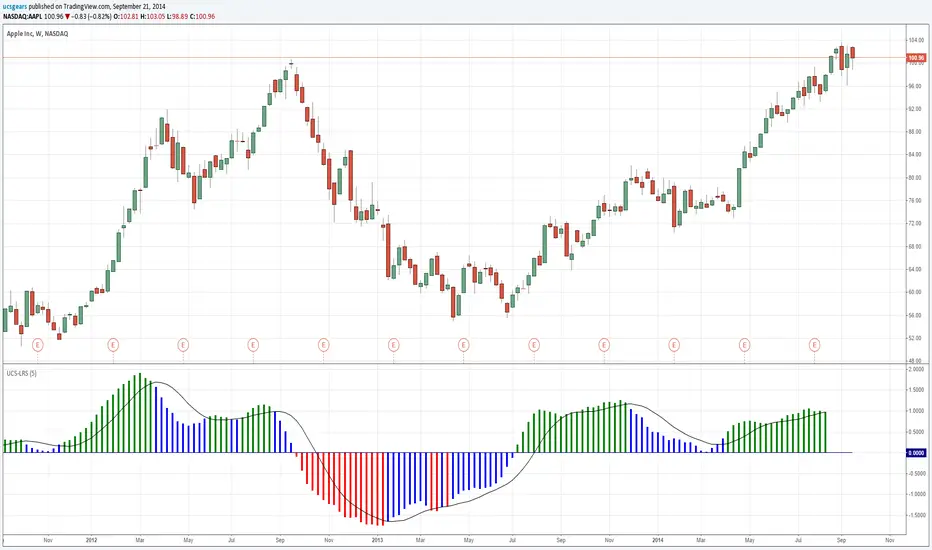
This is version 1 of the Linear Regression Slope. In ideal world the Linear regression slope values will remain same for any time period length. because the equation is y = mx+b, where m is the slope. All I did here is m = y/x
The Main Purpose of this indicator is to see, if the Trend is accelerating or decelerating.
The first Blue bar will caution when a strong trend is losing strength. I will leave the rest for you to explore.
I picked AAPL again, because it does have both up and down trend, in the recent time.
Mistake in the code
Corrected Version - tradingview.com/v/ec2jvh2Z/
開源腳本
本著TradingView的真正精神,此腳本的創建者將其開源,以便交易者可以查看和驗證其功能。向作者致敬!雖然您可以免費使用它,但請記住,重新發佈程式碼必須遵守我們的網站規則。
Uday C Santhakumar
免責聲明
這些資訊和出版物並不意味著也不構成TradingView提供或認可的金融、投資、交易或其他類型的意見或建議。請在使用條款閱讀更多資訊。
開源腳本
本著TradingView的真正精神,此腳本的創建者將其開源,以便交易者可以查看和驗證其功能。向作者致敬!雖然您可以免費使用它,但請記住,重新發佈程式碼必須遵守我們的網站規則。
Uday C Santhakumar
免責聲明
這些資訊和出版物並不意味著也不構成TradingView提供或認可的金融、投資、交易或其他類型的意見或建議。請在使用條款閱讀更多資訊。