15-Min ORB Indicator with Breakout Targets **What this indicator does:**
The 15-Min ORB (Opening Range Breakout) Indicator helps traders spot breakout trades by automatically detecting the high and low of the first 15 minutes after a session opens. It then monitors for breakouts above or below this range and plots dynamic take-profit levels based on your chosen multipliers.
**How it works:**
You set the start time for your session (hour and minute) in the settings.
The indicator marks the high and low during the first 15 minutes after your chosen open time, drawing lines on the chart and, if enabled, labels for these levels.
If price breaks above the 15-min high, a potential long breakout is identified; if it breaks below the low, a potential short breakout is detected.
Upon a breakout, the script calculates the distance from the entry (breakout) to the opposite side of the 15-min range and uses your input multipliers to project two take-profit levels (TP1/TP2).
All lines and labels (for the range and targets) can be individually toggled on or off in the settings.
Both the 15-min range and the targets can be styled (color, line style, label position).
**How to use it:**
Add the indicator to your chart.
Set the session start hour and minute to match your instrument’s open (e.g., 9:30 for US stocks or futures).
Use the settings to customize which levels and labels are shown, their appearance, and the target expansion multiples.
When price breaks out above or below the opening range, the script will plot TP1 and TP2 lines at your chosen risk/reward multiples, and label them if desired.
You can use the visual levels for trade entries, profit taking, or alerts.
**What makes it unique and useful:** >
Unlike many basic ORB indicators, this script not only marks the opening range but also tracks breakouts, auto-plots your profit targets based on range expansion, and gives you full control over display (styles, toggles, and label positions).
The TP targets are dynamic and can be set to any multiples, adapting to your risk/reward plan and breakout style.
Everything is customizable for your own session times, instrument, or trading approach.
**Typical uses:**
Intraday traders looking for clear breakout setups around the session open.
Automated R-multiple target planning for both long and short trades.
Visualizing volatility and measuring early price expansion.
Breakout

FS JIMENEZ)FS JIMENEZ is a tactical breakout-retest strategy optimized for volatile price action and disciplined entries. It features:
• Swing structure validation
• Smart cooldown and price spacing logic
• SL compression after 3 bars
• Dynamic TP targeting based on candle strength and ATR
• Optional trailing SL via buffer multiplier
Built for traders seeking precision and controlled exposure across volati

Bollinger Bands Entry/Exit ThresholdsBollinger Bands Entry/Exit Thresholds
Author of enhancements: chuckaschultz
Inspired and adapted from the original 'Bollinger Bands Breakout Oscillator' by LuxAlgo
Overview
Pairs nicely with Contrarian 100 MA
The Bollinger Bands Entry/Exit Thresholds is a powerful momentum-based indicator designed to help traders identify potential entry and exit points in trending or breakout markets. By leveraging Bollinger Bands, this indicator quantifies price deviations from the bands to generate bullish and bearish momentum signals, displayed as an oscillator. It includes customizable entry and exit signals based on user-defined thresholds, with visual cues plotted either on the oscillator panel or directly on the price chart.
This indicator is ideal for traders looking to capture breakout opportunities or confirm trend strength, with flexible settings to adapt to various markets and trading styles.
How It Works
The Bollinger Bands Entry/Exit Thresholds calculates two key metrics:
Bullish Momentum (Bull): Measures the extent to which the price exceeds the upper Bollinger Band, expressed as a percentage (0–100).
Bearish Momentum (Bear): Measures the extent to which the price falls below the lower Bollinger Band, also expressed as a percentage (0–100).
The indicator generates:
Long Entry Signals: Triggered when the bearish momentum (bear) crosses below a user-defined Long Threshold (default: 40). This suggests weakening bearish pressure, potentially indicating a reversal or breakout to the upside.
Exit Signals: Triggered when the bullish momentum (bull) crosses below a user-defined Sell Threshold (default: 80), indicating a potential reduction in bullish momentum and a signal to exit long positions.
Signals are visualized as tiny colored dots:
Long Entry: Blue dots, plotted either at the bottom of the oscillator or below the price bar (depending on user settings).
Exit Signal: White dots, plotted either at the top of the oscillator or above the price bar.
Calculation Methodology
Bollinger Bands:
A user-defined Length (default: 14) is used to calculate an Exponential Moving Average (EMA) of the source price (default: close).
Standard deviation is computed over the same length, multiplied by a user-defined Multiplier (default: 1.0).
Upper Band = EMA + (Standard Deviation × Multiplier)
Lower Band = EMA - (Standard Deviation × Multiplier)
Bull and Bear Momentum:
For each bar in the lookback period (length), the indicator calculates:
Bullish Momentum: The sum of positive deviations of the price above the upper band, normalized by the total absolute deviation from the upper band, scaled to a 0–100 range.
Bearish Momentum: The sum of positive deviations of the price below the lower band, normalized by the total absolute deviation from the lower band, scaled to a 0–100 range.
Formula:
bull = (sum of max(price - upper, 0) / sum of abs(price - upper)) * 100
bear = (sum of max(lower - price, 0) / sum of abs(lower - price)) * 100
Signal Generation:
Long Entry: Triggered when bear crosses below the Long Threshold.
Exit: Triggered when bull crosses below the Sell Threshold.
Settings
Length: Lookback period for EMA and standard deviation (default: 14).
Multiplier: Multiplier for standard deviation to adjust Bollinger Band width (default: 1.0).
Source: Input price data (default: close).
Long Threshold: Bearish momentum level below which a long entry signal is generated (default: 40).
Sell Threshold: Bullish momentum level below which an exit signal is generated (default: 80).
Plot Signals on Main Chart: Option to display entry/exit signals on the price chart instead of the oscillator panel (default: false).
Style:
Bullish Color: Color for bullish momentum plot (default: #f23645).
Bearish Color: Color for bearish momentum plot (default: #089981).
Visual Features
Bull and Bear Plots: Displayed as colored lines with gradient fills for visual clarity.
Midline: Horizontal line at 50 for reference.
Threshold Lines: Dashed green line for Long Threshold and dashed red line for Sell Threshold.
Signal Dots:
Long Entry: Tiny blue dots (below price bar or at oscillator bottom).
Exit: Tiny white dots (above price bar or at oscillator top).
How to Use
Add to Chart: Apply the indicator to your TradingView chart.
Adjust Settings: Customize the Length, Multiplier, Long Threshold, and Sell Threshold to suit your trading strategy.
Interpret Signals:
Enter a long position when a blue dot appears, indicating bearish momentum dropping below the Long Threshold.
Exit the long position when a white dot appears, indicating bullish momentum dropping below the Sell Threshold.
Toggle Plot Location: Enable Plot Signals on Main Chart to display signals on the price chart for easier integration with price action analysis.
Combine with Other Tools: Use alongside other indicators (e.g., trendlines, support/resistance) to confirm signals.
Notes
This indicator is inspired by LuxAlgo’s Bollinger Bands Breakout Oscillator but has been enhanced with customizable entry/exit thresholds and signal plotting options.
Best used in conjunction with other technical analysis tools to filter false signals, especially in choppy or range-bound markets.
Adjust the Multiplier to make the Bollinger Bands wider or narrower, affecting the sensitivity of the momentum calculations.
Disclaimer
This indicator is provided for educational and informational purposes only.

Heatmap Trailing Stop with Breakouts (Zeiierman)█ Overview
Heatmap Trailing Stop with Breakouts (Zeiierman) is a trend and breakout detection tool that combines dynamic trailing stop logic, Fibonacci-based levels, and a real-time market heatmap into a single, intuitive system.
This indicator is designed to help traders visualize pressure zones, manage stop placement, and identify breakout opportunities supported by contextual price–derived heat. Whether you're trailing trends, detecting reversals, or entering on explosive breakouts — this tool keeps you anchored in structure and sentiment.
It projects adaptive trailing stop levels and calculates Fibonacci extensions from swing-based extremes. These levels are then colored by a market heatmap engine that tracks price interaction intensity — showing where the market is "hot" and likely to respond.
On top of that, it includes breakout signals powered by HTF momentum conditions, trend direction, and heatmap validation — giving you signals only when the context is strong.
█ How It Works
⚪ Trailing Stop Engine
At its core, the script uses an ATR-based trailing stop with trend detection:
ATR Length – Defines volatility smoothing using EMA MA of true range.
Multiplier – Expands/retracts the trailing offset depending on market aggression.
Real-Time Extremum Tracking – Uses local highs/lows to define Fibonacci anchors.
⚪ Fibonacci Projection + Heatmap
With each trend shift, Fibonacci levels are projected from the new swing to the current trailing stop. These include:
Fib 61.8, 78.6, 88.6, and 100% (trailing stop) lines
Heatmap Coloring – Each level'slevel's color is determined by how frequently price has interacted with that level in the recent range (defined by ATR).
Strength Score (1–10) – The number of touches per level is normalized and averaged to create a heatmap ""score"" displayed as a colored bar on the chart.
⚪ Breakout Signal System
This engine detects high-confidence breakout signals using a higher timeframe candle structure:
Bullish Breakout – Strong bullish candle + momentum + trend confirmation + heatmap score threshold.
Bearish Breakout – Strong bearish candle + momentum + trend confirmation + heatmap score threshold.
Cooldown Logic – Prevents signals from clustering too frequently during volatile periods.
█ How to Use
⚪ Trend Following & Trail Stops
Use the Trailing Stop line to manage positions or time entries in line with trend direction. Trailing stop flips are highlighted with dot markers.
⚪ Fibonacci Heat Zones
The projected Fibonacci levels serve as price magnets or support/resistance zones. Watch how price reacts at Fib 61.8/78.6/88.6 levels — especially when they're glowing with high heatmap scores (more glow = more historical touches = stronger significance).
⚪ Breakout Signals
Enable breakout signals when you want to trade breakouts only under strong context. Use the "Heatmap Strength Threshold" to require a minimum score (1–10).
█ Settings
Stop Distance ATR Length – ATR period for volatility smoothing
Stop Distance Multiplier – Adjusts the trailing stop'sstop's distance from price
Heatmap Range ATR Length – Defines how far back the heatmap scans for touches
Number of Heat Levels – Total levels used in the heatmap (more = finer resolution)
Minimum Touches per Level – Defines what counts as a ""hot"" level
Heatmap Strength Threshold – Minimum average heat score (1–10) required for breakouts
Timeframe – HTF source used to evaluate breakout momentum structure
-----------------
Disclaimer
The content provided in my scripts, indicators, ideas, algorithms, and systems is for educational and informational purposes only. It does not constitute financial advice, investment recommendations, or a solicitation to buy or sell any financial instruments. I will not accept liability for any loss or damage, including without limitation any loss of profit, which may arise directly or indirectly from the use of or reliance on such information.
All investments involve risk, and the past performance of a security, industry, sector, market, financial product, trading strategy, backtest, or individual's trading does not guarantee future results or returns. Investors are fully responsible for any investment decisions they make. Such decisions should be based solely on an evaluation of their financial circumstances, investment objectives, risk tolerance, and liquidity needs.

CNN Statistical Trading System [PhenLabs]📌 DESCRIPTION
An advanced pattern recognition system utilizing Convolutional Neural Network (CNN) principles to identify statistically significant market patterns and generate high-probability trading signals.
CNN Statistical Trading System transforms traditional technical analysis by applying machine learning concepts directly to price action. Through six specialized convolution kernels, it detects momentum shifts, reversal patterns, consolidation phases, and breakout setups simultaneously. The system combines these pattern detections using adaptive weighting based on market volatility and trend strength, creating a sophisticated composite score that provides both directional bias and signal confidence on a normalized -1 to +1 scale.
🚀 CONCEPTS
• Built on Convolutional Neural Network pattern recognition methodology adapted for financial markets
• Six specialized kernels detect distinct price patterns: upward/downward momentum, peak/trough formations, consolidation, and breakout setups
• Activation functions create non-linear responses with tanh-like behavior, mimicking neural network layers
• Adaptive weighting system adjusts pattern importance based on current market regime (volatility < 2% and trend strength)
• Multi-confirmation signals require CNN threshold breach (±0.65), RSI boundaries, and volume confirmation above 120% of 20-period average
🔧 FEATURES
Six-Kernel Pattern Detection:
Simultaneous analysis of upward momentum, downward momentum, peak/resistance, trough/support, consolidation, and breakout patterns using mathematically optimized convolution kernels.
Adaptive Neural Architecture:
Dynamic weight adjustment based on market volatility (ATR/Price) and trend strength (EMA differential), ensuring optimal performance across different market conditions.
Professional Visual Themes:
Four sophisticated color palettes (Professional, Ocean, Sunset, Monochrome) with cohesive design language. Default Monochrome theme provides clean, distraction-free analysis.
Confidence Band System:
Upper and lower confidence zones at 150% of threshold values (±0.975) help identify high-probability signal areas and potential exhaustion zones.
Real-Time Information Panel:
Live display of CNN score, market state with emoji indicators, net momentum, confidence percentage, and RSI confirmation with dynamic color coding based on signal strength.
Individual Feature Analysis:
Optional display of all six kernel outputs with distinct visual styles (step lines, circles, crosses, area fills) for advanced pattern component analysis.
User Guide
• Monitor CNN Score crossing above +0.65 for long signals or below -0.65 for short signals with volume confirmation
• Use confidence bands to identify optimal entry zones - signals within confidence bands carry higher probability
• Background intensity reflects signal strength - darker backgrounds indicate stronger conviction
• Enter long positions when blue circles appear above oscillator with RSI < 75 and volume > 120% average
• Enter short positions when dark circles appear below oscillator with RSI > 25 and volume confirmation
• Information panel provides real-time confidence percentage and momentum direction for position sizing decisions
• Individual feature plots allow granular analysis of specific pattern components for strategy refinement
💡Conclusion
CNN Statistical Trading System represents the evolution of technical analysis, combining institutional-grade pattern recognition with retail accessibility. The six-kernel architecture provides comprehensive market pattern coverage while adaptive weighting ensures relevance across all market conditions. Whether you’re seeking systematic entry signals or advanced pattern confirmation, this indicator delivers mathematically rigorous analysis with intuitive visual presentation.

Support and Resistance Logistic Regression | Flux Charts💎 GENERAL OVERVIEW
Introducing our new Logistic Regression Support / Resistance indicator! This tool leverages advanced statistical modeling "Logistic Regressions" to identify and project key price levels where the market is likely to find support or resistance. For more information about the process, please check the "HOW DOES IT WORK ?" section.
Logistic Regression Support / Resistance Features :
Intelligent S/R Identification : The indicator uses a logistic regression model to intelligently identify and plot significant support and resistance levels.
Predictive Probability : Each identified level comes with a calculated probability, indicating how likely it is to act as a true support or resistance based on historical data.
Retest & Break Labels : The indicator clearly marks on your chart when a detected support or resistance level is retested (price touches and respects the level) or broken (price decisively crosses through the level).
Alerts : Real-time alerts for support retests, resistance retests, support breaks, and resistance breaks.
Customizable : You can change support & resistance line style, width and colors.
🚩 UNIQUENESS
What makes this indicator truly unique is its application of logistic regression to the concept of support and resistance. Instead of merely identifying historical highs and lows, our indicator uses a statistical model to predict the future efficacy of these levels. It analyzes underlying market conditions (like RSI and body size at pivot formation) to assign a probability to each potential S/R zone. This predictive insight, combined with dynamic, real-time labeling of retests and breaks, provides a more robust and adaptive understanding of market structure than traditional, purely historical methods.
📌HOW DOES IT WORK ?
The Logistic Regression Support / Resistance indicator operates in several key steps:
First, it identifies significant pivot highs and lows on the chart based on a user-defined "Pivot Length." These pivots are potential areas of support or resistance.
For each detected pivot, the indicator extracts relevant market data at that specific point, including the RSI (Relative Strength Index) and the Body Size (the absolute difference between the open and close price of the candle). These serve as input features for the model.
The core of the indicator lies in its logistic regression model. This model is continuously trained on past pivot data and their subsequent behavior (i.e., whether they were "respected" as support/resistance multiple times). It learns the relationship between the extracted features (RSI, Body Size) and the likelihood of a pivot becoming a significant S/R level.
When a new pivot is identified, the model uses its learned insights to calculate a prediction value—a probability (from 0 to 1) that this specific pivot will act as a strong support or resistance.
If the calculated probability exceeds a user-defined "Probability Threshold," the pivot is designated a "Regression Pivot" and drawn on the chart as a support or resistance line. The indicator then actively tracks how price interacts with these levels, displaying "R" labels for retests when the price bounces off the level and "B" labels for breaks when the price closes beyond it.
⚙️ SETTINGS
1. General Configuration
Pivot Length: This setting defines the number of bars used to determine a significant high or low for pivot detection.
Target Respects: This input specifies how many times a level must be "respected" by price action for it to be considered a strong support or resistance level by the underlying model.
Probability Threshold: This is the minimum probability output from the logistic regression model for a detected pivot to be considered a valid support or resistance level and be plotted on the chart.
2. Style
Show Prediction Labels: Enable or disable labels that display the calculated probability of a newly identified regression S/R level.
Show Retests: Toggle the visibility of "R" labels on the chart, which mark instances where price has retested a support or resistance level.
Show Breaks: Toggle the visibility of "B" labels on the chart, which mark instances where price has broken through a support or resistance level.

Candle Breakout Oscillator [LuxAlgo]The Candle Breakout Oscillator tool allows traders to identify the strength and weakness of the three main market states: bullish, bearish, and choppy.
Know who controls the market at any given moment with an oscillator display with values ranging from 0 to 100 for the three main plots and upper and lower thresholds of 80 and 20 by default.
🔶 USAGE
The Candle Breakout Oscillator represents the three main market states, with values ranging from 0 to 100. By default, the upper and lower thresholds are set at 80 and 20, and when a value exceeds these thresholds, a colored area is displayed for the trader's convenience.
This tool is based on pure price action breakouts. In this context, we understand a breakout as a close above the last candle's high or low, which is representative of market strength. All other close positions in relation to the last candle's limits are considered weakness.
So, when the bullish plot (in green) is at the top of the oscillator (values above 80), it means that the bullish breakouts (close below the last candle low) are at their maximum value over the calculation window, indicating an uptrend. The same interpretation can be made for the bearish plot (in red), indicating a downtrend when high.
On the other hand, weakness is indicated when values are below the lower threshold (20), indicating that breakouts are at their minimum over the last 100 candles. Below are some examples of the possible main interpretations:
There are three main things to look for in this oscillator:
Value reaches extreme
Value leaves extreme
Bullish/Bearish crossovers
As we can see on the chart, before the first crossover happens the bears come out of strength (top) and the bulls come out of weakness (bottom), then after the crossover the bulls reach strength (top) and the bears weakness (bottom), this process is repeated in reverse for the second crossover.
The other main feature of the oscillator is its ability to identify periods of sideways trends when the sideways values have upper readings above 80, and trending behavior when the sideways values have lower readings below 20. As we just saw in the case of bullish vs. bearish, sideways values signal a change in behavior when reaching or leaving the extremes of the oscillator.
🔶 DETAILS
🔹 Data Smoothing
The tool offers up to 10 different smoothing methods. In the chart above, we can see the raw data (smoothing: None) and the RMA, TEMA, or Hull moving averages.
🔹 Data Weighting
Users can add different weighting methods to the data. As we can see in the image above, users can choose between None, Volume, or Price (as in Price Delta for each breakout).
🔶 SETTINGS
Window: Execution window, 100 candles by default
🔹 Data
Smoothing Method: Choose between none or ten moving averages
Smoothing Length: Length for the moving average
Weighting Method: Choose between None, Volume, or Price
🔹 Thresholds
Top: 80 by default
Bottom: 20 by default

Trailing Stop Loss [TradingFinder] 4 Machine Learning Methods🔵 Introduction
The trailing stop indicator dynamically adjusts stop-loss (SL) levels to lock in profits as price moves favorably. It uses pivot levels and ATR to set optimal SL points, balancing risk and reward.
Trade confirmation filters, a key feature, ensure entries align with market conditions, reducing false signals. In 2023 a study showed filtered entries improve win rates by 15% in forex. This enhances trade precision.
SL settings, ranging from very tight to very wide, adapt to volatility via ATR calculations. These settings anchor SL to previous pivot levels, ensuring alignment with market structure. This caters to diverse trading styles, from scalping to swing trading.
The indicator colors the profit zone between the entry point (EP) and SL, using light green for buy trades and light red for sell trades. This visual cue highlights profit potential. It’s ideal for traders seeking dynamic risk management.
A table displays real-time trade details, including EP, SL, and profit/loss (PNL). Backtests show trailing stops cut losses by 20% in trending markets. This transparency aids decision-making.
🔵 How to Use
🟣 SL Levels
The trailing stop indicator sets SL based on pivot levels and ATR, offering four options: very tight, tight, wide, or very wide. Very tight SLs suit scalpers, while wide SLs fit swing traders. Select the base level to match your strategy.
If price hits the SL, the trade closes, and the indicator evaluates the next trade using the selected filter. This ensures disciplined trade management. The cycle restarts with a new confirmed entry.
Very tight SLs, set near recent pivots, trigger exits early to minimize risk but limit profits in volatile markets. Wide SLs, shown as farther lines, allow more price movement but increase exposure to losses. Adjust based on ATR and conditions, noting SL breaches open new positions.
🟣 Visualization
The indicator’s visual cues, like colored profit zones, simplify monitoring, with light green showing the profit area from EP to trailed SL. Dashed lines mark entry points, while solid lines track the trailed SL, triggering new positions when breached.
When price moves into profit, the area between EP and SL is colored—light green for longs, light red for shorts. This highlights the profit zone visually. The SL trails price, locking in gains as the trade progresses.
🟣 Filters
Upon trade entry, the indicator requires confirmation via filters like SMA 2x or ADX to validate momentum. Filters reduce false entries, though no guarantee exists for improved outcomes. Monitor price action post-entry for trade validity.
Filters like Momentum or ADX assess trend strength before entry. For example, ADX above 25 confirms strong trends. Choose “none” for unfiltered entries.
🟣 Bullish Alert
For a bullish trade, the indicator opens a long position with a green SL Line (after optional filters), trailing the SL below price. Set alerts to On in the settings for notifications, or Off to monitor manually.
🟣 Bearish Alert
In a bearish trade, the indicator opens a short position with a red SL Line post-confirmation, trailing the SL above price. With alerts On in the settings, it notifies the potential reversal.
🟣 Panel
A table displays all trades’ details, including Win Rates, PNL, and trade status. This real-time data aids in tracking performance. Check the table to assess trade outcomes instantly.
Review the table regularly to evaluate trade performance and adjust settings. Consistent monitoring ensures alignment with market dynamics. This maximizes the indicator’s effectiveness.
🔵 Settings
Length (Default: 10) : Sets the pivot period for calculating SL levels, balancing sensitivity and reliability.
Base Level : Options (“Very tight,” “Tight,” “Wide,” “Very wide”) adjust SL distance via ATR.
Show EP Checkbox : Toggles visibility of the entry point on the chart.
Show PNL : Displays profit/loss data for active and closed trades.
Filter : Options (“none,” “SMA 2x,” “Momentum,” “ADX”) validate trade entries.
🔵 Conclusion
The trailing stop indicator, a dynamic risk management tool, adjusts SLs using pivot levels and ATR. Its confirmation filters reduce false entries, boosting precision. Backtests show 20% loss reduction in trending markets.
Customizable SL settings and visual profit zones enhance usability across trading styles. The real-time table provides clear trade insights, streamlining analysis. It’s ideal for forex, stocks, or crypto.
While filters like ADX improve entry accuracy, no setup guarantees success in all conditions. Contextual analysis, like trend strength, is key. This indicator empowers disciplined, data-driven trading.

Opening Range Breakout Detector📈 Opening Range Breakout Detector (TF-Independent)
Tracks breakouts with precision. No matter the chart, no matter the timeframe.
This indicator monitors whether price breaks above or below the Opening Range across multiple key durations — 1m, 5m, 10m, 15m, 30m, 45m, and 60m — using 1-minute data under the hood, while you can work on higher timeframe charts (daily, etc.).
Highlights:
✅ Status table shows which ORs broke UP or DOWN
⏱ Control which timeframes to track
🖼 Customizable table position, size and colors
Crafted by @FunkyQuokka

NYBREAKOUT by FliuxStrategy Concept
This strategy captures high-probability breakout moves by defining a tight 30-minute range during low-volatility hours and trading the first clear break beyond that range with a 2:1 reward-to-risk ratio.
Key Benefits
Simplicity: Clear, time-based range and mechanical entries/exits.
Defined R:R: Automatic 2:1 target ensures consistent risk management.
Time-filtered: Trades only the initial breakout of a calm, pre-session range.
How to Use
Add to Chart: Paste the Pine Script into TradingView’s Pine Editor, then click Add to Chart.
Backtest: Open Strategy Tester to review net profit, drawdown, win rate, and profit factor.
Optimize: Adjust stop-loss offset, R:R ratio, or session window parameters to suit different instruments or volatility regimes.

Moving Volume-Weighted Avg Price, % Channel, BBsThis script includes:
- Moving Volume-Weighted Average Price line.
- User-defined % band above and below, very useful for "breakout" signals, and mentally adjusting to the magnitude of price swings when viewing an automatic scale on the price axis.
- Volume-Weighted Bollinger Bands, which are more sensitive to volume.
More detail:
- This is like TV's basic VWAP in concept, except the major flaw in that is that it has reset periods that you can't override, and the volume is cumulative until the next hard reset. The 'reset' is OK for securities trading, that resets every day anyway. But not for crypto - and not if/when securities trading goes 24/7. Also, the denominator accumulating over the entire period is also *not* OK, because then what is shown means something different as the day progresses - which kind of makes it useless. In other words, it starts out very sensitive to volume, and gets progressively more numb to it as they day progresses, and starts flattening out.
- This fixes both problems, by using a user-definable moving window for the average. Essentially combining SMA with volume-weighting.
- You may also find an invaluable trading aid, in the % bands above and below.
- What can optionally be shown is standard deviation bands, aka Bollinger bands. The advantage over regular BB is that it's volume-weighted. Since it is already calculated on a moving average, the period for the standard deviation has been shortened by default, and the magnitude increased, to better approximate regular Bollinger Bands - but it's still more responsive to volume.

NR4 & NR7 with Breakouts [LuxAlgo]NR4 & NR7 with Breakouts is a simple indicator that utilizes the NR4 and NR7 candle patterns to display candle ranges and signals from range breakouts.
🔶 USAGE
The Narrow Range Patterns are candle formations determined by the last candle having a narrower (high-low) range than the previous number. This indicator showcases the 2 most recognized Narrow Range Patterns, which are the 4 and 7 bar variants (NR4 and NR7).
These patterns, introduced by Toby Crabel, are thought to provide insight for potential market breakouts by identifying periods of low volatility indicated by a candle with a small range. This is due to the idea that markets often move from periods of low volatility (contraction) to high volatility (expansion), and the NR4 and NR7 patterns help spot these transitions.
By utilizing these patterns, traders are better able to anticipate and respond to market shifts for better decision-making and risk management.
NOTE: These patterns have traditionally been studied on the Daily Timeframe Chart. This indicator allows the user to select a timeframe to generate these patterns from. It is suggested to be mindful of this when considering these patterns.
In this indicator, on the bar after the pattern is detected, the Narrow Range Bar will be highlighted with a zone, and lines displaying the range will extend from it. These ranges are helpful for providing levels to set limit orders and for managing risk.
Users are able to adjust which pattern they want visualized on their chart, please note;
All NR7s are NR4s but not all NR4s are NR7s.
Because of this, you will notice that when selecting "NR4" to display, the colors will change, but the detected ranges will not change.
🔹 Signals
When a Narrow Range Bar is detected, the script will wait for the price to close outside of the Range, then a signal will fire indicating the direction of exit. The signals are produced from the last NR4 or NR7 and will have the potential to fire from that range until a new NR4 or NR7 is detected.
After a signal fires, the logic goes into a "reset" period where it will wait for the price to reach the Range Mean before firing another signal.
These signals can be anticipated by considering the underlying logic and watching price approach the range extremities, and can be improved by utilizing other market information for confluence.
🔶 SETTINGS
Timeframe: Choose which timeframe to identify the NR4 and NR7 Pattern on. This must be Higher than the chart timeframe.
Pattern Type: Choose which (or all) patterns to display.

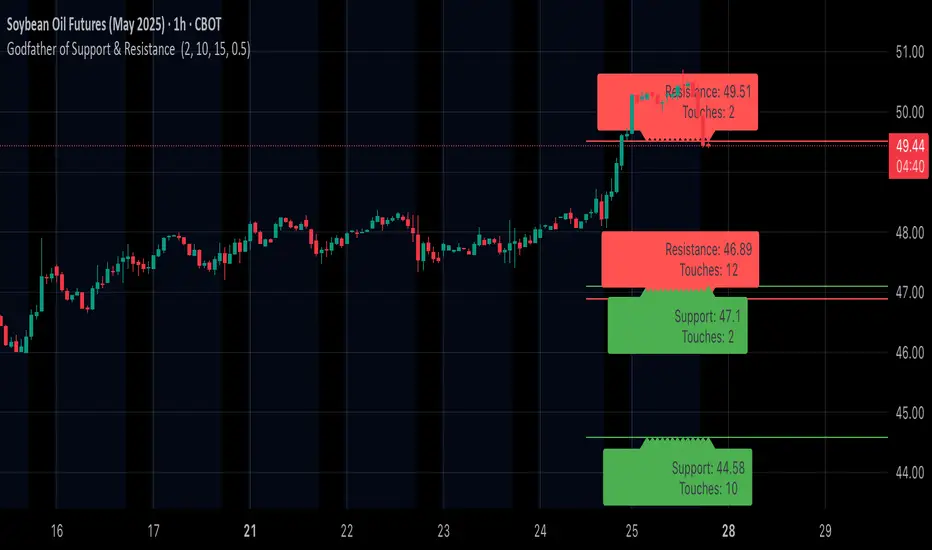
Godfather of Support & Resistance Godfather of Support & Resistance
Overview
The Godfather of Support & Resistance script is a powerful tool designed to help traders identify critical support and resistance levels on their charts. These price levels are vital for understanding market behavior, as they often act as turning points where prices reverse, consolidate, or break through. By automating the detection of these levels, this script simplifies your trading decisions and enhances your technical analysis.
How It Works
Pivot Points for Level Detection:
The script uses pivot points to identify potential support (lows) and resistance (highs) levels:
A pivot high is a local peak (a high surrounded by lower highs).
A pivot low is a local trough (a low surrounded by higher lows).
You can adjust the Pivot Length (pivotLen) input to control the sensitivity of detection. Smaller values detect more levels, while larger values focus on major levels.
Dynamic Grouping with Tolerance:
The script dynamically groups nearby price levels using a tolerance percentage. This tolerance is based on the level's price, making it adaptive to all types of assets (low- and high-priced).
For example, if the tolerance is set to 1% and a level is at $100, levels within $1 are grouped together.
Touch Count for Significance:
The script tracks how many times the price interacts with each level (touch count). Only levels that meet or exceed the Minimum Touches (minTouches) input are displayed on the chart. This ensures only meaningful levels are highlighted.
Clear Visual Representation:
Resistance Levels (Red Lines): Represent areas where the price tends to reverse downward.
Support Levels (Green Lines): Represent areas where the price tends to reverse upward.
Labels are added to each level (optional) to display the price and the number of touches for better decision-making.
Inputs You Can Customize
Minimum Touches to Show Level:
Set the minimum number of price interactions required for a level to be displayed.
Maximum Lines to Keep:
Limit the number of support and resistance lines displayed to keep your chart clean and focused.
Pivot Length:
Customize the sensitivity of pivot point detection. Smaller values detect more levels, while larger values focus on key levels.
Tolerance for Touch Detection (%):
Adjust the grouping tolerance as a percentage of the price. For example, 1% groups levels that are within 1% of each other.
How to Use
Apply the Script:
Add the script to your TradingView chart, and it will automatically detect and plot support and resistance levels.
Analyze the Levels:
Use Resistance Levels (red lines) as potential sell zones or areas to place stop-loss orders above.
Use Support Levels (green lines) as potential buy zones or areas to place stop-loss orders below.
Customize for Your Trading Style:
Adjust the inputs to match your preferred strategy and the timeframe or asset you're analyzing.
Example Use Case
Imagine you're analyzing a stock:
Resistance Level: The script identifies resistance at $150 with 3 touches. This might be a potential sell zone if the price struggles to break through.
Support Level: The script identifies support at $130 with 4 touches. This might be a potential buy zone if the price shows signs of bouncing upward.
Key Features
Automatically detects and plots support and resistance levels.
Tracks the number of price touches to filter out weak levels.
Adapts dynamically to price ranges using a percentage-based tolerance.
Fully customizable to suit different trading styles and assets.
Clean and professional chart display with a limit on the number of lines.
Notes
This script is for educational purposes only and should not be considered financial advice.
Always perform your own analysis and manage risk before making trading decisions.
Why Use This Script?
The Godfather of Support & Resistance script simplifies your trading decisions by automating the detection of critical price levels. Whether you're a beginner or an experienced trader, this script is designed to save you time and help you focus on making informed trades.
Start using it today to master the art of support and resistance trading!
Let me know if you need further refinements for this description!
Open - CSC Bars - 33 CSC Bars – Early Session Price Action Filter
This script detects when the first three bars of the RTH (Regular Trading Hours) session all move in the same direction — either all bullish or all bearish.
It’s a tool for price action traders who want to develop structured opening strategies by observing clean directional agreement at the session start. The indicator highlights the third bar when the sequence confirms directional bias.
🔍 How It Works:
Monitors the first three bars after the RTH session begins.
If all three bars are bullish, it highlights the third bar (same for bearish sequences).
No projections, signals, or entries—purely a visual tool to observe and study opening behavior.
🎯 Use Case:
This script is designed to help traders build and test opening-based frameworks by identifying potential trend bias early in the day.
Note: This is an open-source utility script with a simple function. It does not generate signals or predictions and is intended to assist with observation and discretionary strategy building.

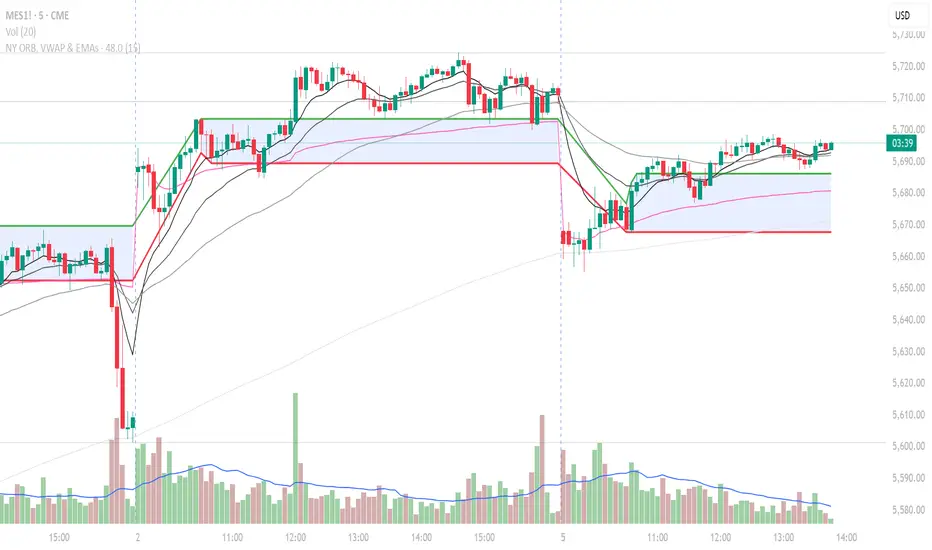
NY ORB, VWAP & EMAsIndicator is designed to display key technical analysis tools on your Trading View chart. It includes:
One of the key benefits of this indicator is that it allows Basic Trading View users to set VWAP, EMAs, and ORB in a single indicator. This is particularly useful for users who are limited to a single indicator on their Basic plan, as it provides a comprehensive view of market sentiment, trend, and potential breakouts without the need for multiple indicators.
Features
New York Opening Range Breakout (ORB): Plots the high and low of the first 15 minutes (configurable) of the New York trading session.
Volume Weighted Average Price (VWAP): Displays the VWAP line, which can be toggled on or off.
Exponential Moving Averages (EMAs): Plots four EMAs (9, 21, 50, and 200 periods), which can also be toggled on or off.
Customization
ORB Length: Choose from 5 or 15 minutes for the ORB calculation.
Show VWAP and EMAs: Toggle the visibility of the VWAP and EMA lines on or off.
Usage
This indicator is designed to help traders identify key market levels, trends, and potential breakouts during the New York trading session. The ORB can be used to gauge market sentiment, while the VWAP provides a benchmark for average price action. The EMAs offer additional trend analysis and can be used to identify potential support and resistance levels.
VoluTility🌊 VoluTility forecasts trend exhaustion, breakout pressure, and structural inflection by measuring volatility within the effort stream. Built on the concept of ATR applied to volume, it doesn’t read raw volume — it reveals whether that volume is stable, chaotic, or compressing ahead of a move. The goal is to detect structural setups before they resolve. The lower the timeframe, the greater the alpha.
🧠 Core Logic
A zero-centered histogram shows the deviation of smoothed volume from its own volatility baseline. Positive bars indicate expansion; negative bars signal compression. Color reflects rate-of-change in volume volatility. Opacity tracks effort/result strength — showing when moves are real or hollow.
The overlaid ribbon (EMA vs HMA) highlights rhythm shifts. Orange fill signals real expansion; yellow shows decay or absorption. Together, they expose pre-breakout compression and exhaustion tails before price reacts.
🏗️ Structural Read
On the 1H BTC chart shown, price coils into a shallow pullback, compressing within a narrow range marked by shrinking candle bodies and muted wick aggression. A sudden expansion candle breaks the coil cleanly, with no immediate rejection or wick reversion. Price holds above the breakout pivot, establishing a baseline for structural acceptance and shifting bias toward continuation.
🔰 Zone Descriptions
🔴 Volatile blowout
🟠 Clean expansion
🟡 Passive or absorbed effort
🟢 Steady-state rhythm
🔵 Compression coil
🧐 Suggested Use
VoluTility is expressly designed as an overlay for sub-pane indicators, where it acts as a second-order rhythm map — exposing hidden structural pressure within volume or volatility streams. When paired with volume (like ZVOL or OBVX), it highlights when flow is expanding with intent versus fading into noise. When layered over volatility signals (like ATR Turbulence or WIRE), it reveals whether expansion has real effort behind it — or is just structural slack.
It pairs especially well with the Relative Directional Index (RDI), where its histogram and ribbon offer early exhaustion signals before traditional trend or momentum fades appear. On raw momentum tools, it acts as a filter: softening false breaks and confirming pressure-backed continuation.
Run on 15m or lower charts for early entry cues or breakout anticipation. On 1H charts, use it to validate compression resolution or detect fatigue before structure turns. It doesn’t react to price — it forecasts readiness.

ZVOL — Z-Score Volume Heatmapⓩ ZVOL transforms raw volume into a statistically calibrated heatmap using Z-score thresholds. Unlike classic volume indicators that rely on fixed MA comparisons, ZVOL calculates how many standard deviations each volume bar deviates from its mean. This makes the reading adaptive across timeframes and assets, in order to distinguish meaningful crowd behavior from random volatility.
📊 The core display is a five-zone histogram, each encoded by color and statistical depth. Optional background shading mirrors these zones across the entire pane, revealing subtle compression or structural rhythm shifts across time. By grounding the volume reading in volatility-adjusted context, ZVOL inhibits impulsive trading tactics by compelling the structure, not the sentiment, to dictate the signal.
🥵 Heatmap Coloration:
🌚 Suppressed volume — congestion, coiling phases
🩱 Stable flow — early trend or resting volume
🏀 High activity — emerging pressure
💔 Extreme — possible climax or institutional print
🎗️ A dynamic Fibonacci-based 21:34-period EMA ribbon overlays the histogram. The fill area inverts color on crossover, providing a real-time read on tempo, expansion, or divergence between price structure and crowd effort.
💡 LTF Usage Suggestions:
• Confirm breakout legs when orange or red zones align with range exits
• Fade overextended moves when red bars appear into resistance
• Watch for rising EMAs and orange volume to front-run impulsive moves
• Combine with volatility suppression (e.g. ATR) to catch compression → expansion transitions
🥂 Ideal Pairings:
• OBVX Conviction Bias — to confirm directional intent behind volume shifts
• SUPeR TReND 2.718 — for directional filters
• ATR Turbulence Ribbon — to detect compression phases
👥 The OBVX Conviction Bias adds a second dimension to ZVOL by revealing whether crowd effort is aligning with price direction or diverging beneath the surface. While ZVOL identifies statistical anomalies in raw volume, OBVX tracks directional commitment using cumulative volume and moving average cross logic. Use them together to spot fake-outs, anticipate structure-confirmed breakouts, or time pullbacks with volume-based conviction.
🔬 ZVOL isn’t just a volume filter — it’s a structural lens. It reveals when crowd effort is meaningful, when it's fading, and when something is about to shift. Designed for structure-aware traders who care about context, not noise.

Adaptable Relative Momentum Index [ParadoxAlgo]The Adaptable Relative Momentum Index (RMI) by ParadoxAlgo is an advanced momentum-based indicator that builds upon the well-known RSI (Relative Strength Index) concept by introducing a customizable momentum length. This indicator measures price momentum over a specified number of periods and applies a Rolling Moving Average (RMA) to both the positive and negative price changes. The result is a versatile tool that can help traders gauge the strength of a trend, pinpoint overbought/oversold levels, and potentially identify breakout opportunities.
⸻
Smart Configuration Feature
What sets this version of the RMI apart is ParadoxAlgo’s exclusive “Smart Configuration” functionality. Instead of manually adjusting parameters, traders can simply select their Asset Class (e.g., Stocks, Forex, Futures/Indices, Crypto, Commodities) and Trading Style (e.g., Scalping, Day Trading, Swing Trading, Short-Term Investing, Long-Term Investing). Based on these selections, the indicator automatically optimizes its core parameters:
• Length – The period over which the price changes are smoothed.
• Momentum Length – The number of bars used to calculate the price change.
By automating this process, users save time on tedious trial-and-error adjustments, ensuring that the RMI’s settings are tailored to the characteristics of specific markets and personal trading horizons.
⸻
Key Features & Benefits
1. Momentum-Based Insights
• Uses RMA to smooth price movements, helping identify shifts in market momentum more clearly than a basic RSI.
• Enhanced adaptability for a wide range of asset classes and time horizons.
2. Simple Yet Powerful Configuration
• Smart Configuration automatically sets optimal parameter values for each combination of asset class and trading style.
• Eliminates guesswork and manual recalibration when switching between markets or timeframes.
3. Overbought & Oversold Visualization
• Integrated highlight zones mark potential overbought and oversold extremes (default at 80 and 20).
• Optional breakout highlighting draws attention to times when the indicator crosses these key thresholds, helping spot possible entry or exit signals.
4. Intuitive Design & Ease of Use
• Clean plotting and color-coded signal lines make it easy to interpret bullish or bearish shifts in momentum.
• Straightforward dropdown menus keep the interface user-friendly, even for novice traders.
⸻
Practical Applications
• Early Trend Detection: Spot emerging trends when the RMI transitions from oversold to higher levels or vice versa.
• Breakout Confirmation: Confirm potential breakout trades by tracking overbought/oversold breakouts alongside other technical signals.
• Support/Resistance Confluence: Combine RMI signals with horizontal support/resistance levels to reinforce trade decisions.
• Trade Timing: Quickly gauge when momentum could be shifting, helping you time entries and exits more effectively.
⸻
Disclaimer
As with any technical indicator, the Adaptable Relative Momentum Index should be used as part of a broader trading strategy that includes risk management, fundamental analysis, and other forms of technical confirmation. Past performance does not guarantee future results.
⸻
Enjoy using the Adaptable RMI and experience a more streamlined, flexible approach to momentum analysis. Feel free to explore different asset classes and trading styles to discover which configurations resonate best with your unique trading preferences.

TTM Squeeze Momentum MTF [Cometreon]TTM Squeeze Momentum MTF combines the core logic of both the Squeeze Momentum by LazyBear and the TTM Squeeze by John Carter into a single, unified indicator. It offers a complete system to analyze the phase, direction, and strength of market movements.
Unlike the original versions, this indicator allows you to choose how to calculate the trend, select from 15 different types of moving averages, customize every parameter, and adapt the visual style to your trading preferences.
If you are looking for a powerful, flexible and highly configurable tool, this is the perfect choice for you.
🔷 New Features and Improvements
🟩 Unified System: Trend Detection + Visual Style
You can decide which logic to use for the trend via the "Show TTM Squeeze Trend" input:
✅ Enabled → Trend calculated using TTM Squeeze
❌ Disabled → Trend based on Squeeze Momentum
You can also customize the visual style of the indicator:
✅ Enable "Show Histogram" for a visual mode using Histogram, Area, or Column
❌ Disable it to display the classic LazyBear-style line
Everything updates automatically and dynamically based on your selection.
🟩 Full Customization
Every base parameter of the original indicator is now fully configurable: lengths, sources, moving average types, and more.
You can finally adapt the squeeze logic to your strategy — not the other way around.
🟩 Multi-MA Engine
Choose from 15 different Moving Averages for each part of the calculation:
SMA (Simple Moving Average)
EMA (Exponential Moving Average)
WMA (Weighted Moving Average)
RMA (Smoothed Moving Average)
HMA (Hull Moving Average)
JMA (Jurik Moving Average)
DEMA (Double Exponential Moving Average)
TEMA (Triple Exponential Moving Average)
LSMA (Least Squares Moving Average)
VWMA (Volume-Weighted Moving Average)
SMMA (Smoothed Moving Average)
KAMA (Kaufman’s Adaptive Moving Average)
ALMA (Arnaud Legoux Moving Average)
FRAMA (Fractal Adaptive Moving Average)
VIDYA (Variable Index Dynamic Average)
🟩 Dynamic Signal Line
Apply a moving average to the momentum for real-time cross signals, with full control over its length and type.
🟩 Multi-Timeframe & Multi-Ticker Support
You're no longer limited to the chart's current timeframe or ticker. Apply the squeeze to any symbol or timeframe without repainting.
🔷 Technical Details and Customizable Inputs
This indicator offers a fully modular structure with configurable parameters for every component:
1️⃣ Squeeze Momentum Settings – Choose the source, length, and type of moving average used to calculate the base momentum.
2️⃣ Trend Mode Selector – Toggle "Show TTM Squeeze Trend" to select the trend logic displayed on the chart:
✅ Enabled – Shows the trend based on TTM Squeeze (Bollinger Bands inside/outside Keltner Channel)
❌ Disabled – Displays the trend based on Squeeze Momentum logic
🔁 The moving average type for the Keltner Channel is handled automatically, so you don't need to select it manually, even if the custom input is disabled.
3️⃣ Signal Line – Toggle the Signal Line on the Squeeze Momentum. Select its length and MA type to generate visual cross signals.
4️⃣ Bollinger Bands – Configure the length, multiplier, source, and MA type used in the bands.
5️⃣ Keltner Channel – Adjust the length, multiplier, source, and MA type. You can also enable or disable the True Range option.
6️⃣ Advanced MA Parameters – Customize the parameters for advanced MAs (JMA, ALMA, FRAMA, VIDYA), including Phase, Power, Offset, Sigma, and Shift values.
7️⃣ Ticker & Input Source – Select the ticker and manage inputs for alternative chart types like Renko, Kagi, Line Break, and Point & Figure.
8️⃣ Style Settings – Choose how the squeeze is displayed:
Enable "Show Histogram" for Histogram, Area, or Column style
Disable it to show the classic LazyBear-style line
Use Reverse Color to invert line colors
Toggle Show Label to highlight Signal Line cross signals
Customize trend colors to suit your preferences
9️⃣ Multi-Timeframe Options - Timeframe – Use the squeeze on higher timeframes for stronger confirmation
🔟 Wait for Timeframe Closes -
✅ Enabled – Prevents multiple signals within the same candle
❌ Disabled – Displays the indicator smoothly without delay
🔧 Default Settings Reference
To replicate the default settings of the original indicators as they appear when first applied to the chart, use the following configurations:
🟩 TTM Squeeze (John Carter Style)
Squeeze
Length: 20
MA Type: SMA
Show TTM Squeeze Trend: Enabled
Bollinger Bands
Length: 20
Multiplier: 2.0
MA Type: SMA
Keltner Channel
Length: 20
Multiplier: 1.0
Use True Range: ON
MA Type: EMA
Style
Show Histogram: Enabled
Reverse Color: Enabled
🟩 Squeeze Momentum (LazyBear Style)
Squeeze
Length: 10
MA Type: SMA
Show TTM Squeeze Trend: Disabled
Bollinger Bands
Length: 20
Multiplier: 1.5
MA Type: SMA
Keltner Channel
Length: 10
Multiplier: 1.5
Use True Range: ON
MA Type: SMA
Style
Show Histogram: Disabled
Reverse Color: Disabled
⚠️ These values are intended as a starting point. The Cometreon indicator lets you fully customize every input to fit your trading style.
🔷 How to Use Squeeze Momentum Pro
🔍 Identifying Trends
Squeeze Momentum Pro supports two different methods for identifying the trend visually, each based on a distinct logic:
Squeeze Momentum Trend (LazyBear-style):
Displays 3 states based on the position of the Bollinger Bands relative to the Keltner Channel:
🔵 Blue = No Squeeze (BB outside KC and KC outside BB)
⚪️ White = Squeeze Active (BB fully inside KC)
⚫️ Gray = Neutral state (none of the above)
TTM Squeeze Trend (John Carter-style):
Calculates the difference in width between the Bollinger Bands and the Keltner Channel:
🟩 Green = BB width is greater than KC → potential expansion phase
🟥 Red = BB are tighter than KC → possible compression or pre-breakout
📈 Interpreting Signals
Depending on the active configuration, the indicator can provide various signals, including:
Trend color → Reflects the current compression/expansion state (based on selected mode)
Momentum value (above or below 0) → May indicate directional pressure
Signal Line cross → Can highlight momentum shifts
Color change in the momentum → May suggest a potential trend reversal
🛠 Integration with Other Tools
Squeeze Momentum Pro works well alongside other indicators to strengthen market context:
✅ Volume Profile / OBV – Helps confirm accumulation or distribution during squeezes
✅ RSI – Useful to detect divergence between momentum and price
✅ Moving Averages – Ideal for defining primary trend direction and filtering signals
☄️ If you find this indicator useful, leave a Boost to support its development!
Every piece of feedback helps improve the tool and deliver an even better trading experience.
🔥 Share your ideas or feature requests in the comments!

Trendline Breakout Navigator [LuxAlgo]The Trendline Breakout Navigator indicator shows three trendlines, representing trends of different significance between Swing Points.
Dots highlight a Higher Low (HL) or Lower High (LH) that pierces through the Trendline without the closing price breaking the Trendline.
A bar color and background color option is included, which offers insights into the price against the trendlines.
🔶 USAGE
Trendlines (TL) are drawn, starting as a horizontal line from a Swing Point.
When an HL (in the case of a bullish TL) or an LH (bearish TL) is found, this Swing Point is connected to the first Swing Point. In both cases, the TL can be optimized when one or more historical close prices breach the TL (see DETAILS).
A solid-styled long-term trendline represents the overall market direction, while a dashed-styled medium-term trendline captures medium-term movements within the long-term trend. Finally, a dotted-styled short-term trendline tracks short-term fluctuations.
🔹 Swing Points vs. Trend
A "Higher High" (HH) or "Lower Low" (LL) will initialize a new trendline, respectively, starting from the previous "Swing Low" or Swing High".
To spot the trend shift, "HH/LL" labels and an optional background color are included. They can be enabled/disabled or set at "Long, Medium, or Short" term TL (Settings—"MS", "HH/LL" and "Background Color").
These features are linked to one Trendline of choice only.
Where the "HH/LL" labels can show a potential trend shift, the background color is:
Green from the moment the close price breaks above a bearish trendline or when an HH occurs
Red from the moment the close price breaks below a bullish trendline or when an LL occurs
🔹 Bar Color
The bar color will depend on the location of the closing price against the three trendlines. When a trendline is unavailable (for example, if the close price breaks the TL and there is no HH/LL), the last known trendline value will be considered.
All three trendlines influence the bar color.
If the close price is above the "Long Term" TL, the bar color will show a gradient of green, darker when the close price is below the "Medium Term" and/or "Short Term" TLs.
On the other hand, when the close price is below the "Long Term" TL, the bar color will show a gradient of red, which becomes darker when the close price is above the "Medium Term" and/or "Short Term" TLs.
To keep the above example simple, only the "Long Term" TL is considered. The white line (not included in the script) resembles the actual value of the TL at each bar, where you can see the effect on the bar color.
Combined with the trendlines and dots, the bar color can provide extra depth and insights into the underlying trends.
🔹 Tested Trendlines
If a new HL/LH pierces the Trendline without the close price breaking the Trendline, the Trendline will be updated.
The exact location where the price exceeded the Trendline is visualized by a dot, colored blue on a bullish trendline and orange when bearish.
These dots can be indicative of a potential trend continuation or reversal.
🔹 Higher TimeFrame Option
The "Period" setting enables users to visualize higher-timeframe trendlines as long as the line length doesn't exceed 5000 bars.
🔶 DETAILS
When a new trendline is drawn, the script first draws a preliminary line and then checks whether a historical close price exceeded this line above (in the case of a bearish TL) or below (in a bullish case).
Subsequently, the most valid point in between is chosen as the starting point of the Trendline.
🔶 SETTINGS
Period: Choose "chart" for trendlines from the current chart timeframe, or choose a higher timeframe
🔹 Swing Length
Toggle and Swing Length for three trendlines: Period used for the swing detection, with higher values returning longer-term Swing Levels.
🔹 Style
Trendline: color for bullish/bearish Trendline
Wick Dot: color for bullish/bearish trendline test
Term: Long-, medium- or short-term
HH/LL: Show HH/LL labels (with or without previous Swing High/Low) of chosen Term
Background Color: Green when the closing price is above the trendline of choice, red otherwise
Bar Color

Trendline Breaks with Multi Fibonacci Supertrend StrategyTMFS Strategy: Advanced Trendline Breakouts with Multi-Fibonacci Supertrend
Elevate your algorithmic trading with institutional-grade signal confluence
Strategy Genesis & Evolution
This advanced trading system represents the culmination of a personal research journey, evolving from my custom " Multi Fibonacci Supertrend with Signals " indicator into a comprehensive trading strategy. Built upon the exceptional trendline detection methodology pioneered by LuxAlgo in their " Trendlines with Breaks " indicator, I've engineered a systematic framework that integrates multiple technical factors into a cohesive trading system.
Core Fibonacci Principles
At the heart of this strategy lies the Fibonacci sequence application to volatility measurement:
// Fibonacci-based factors for multiple Supertrend calculations
factor1 = input.float(0.618, 'Factor 1 (Weak/Fibonacci)', minval = 0.01, step = 0.01)
factor2 = input.float(1.618, 'Factor 2 (Medium/Golden Ratio)', minval = 0.01, step = 0.01)
factor3 = input.float(2.618, 'Factor 3 (Strong/Extended Fib)', minval = 0.01, step = 0.01)
These precise Fibonacci ratios create a dynamic volatility envelope that adapts to changing market conditions while maintaining mathematical harmony with natural price movements.
Dynamic Trendline Detection
The strategy incorporates LuxAlgo's pioneering approach to trendline detection:
// Pivotal swing detection (inspired by LuxAlgo)
pivot_high = ta.pivothigh(swing_length, swing_length)
pivot_low = ta.pivotlow(swing_length, swing_length)
// Dynamic slope calculation using ATR
slope = atr_value / swing_length * atr_multiplier
// Update trendlines based on pivot detection
if bool(pivot_high)
upper_slope := slope
upper_trendline := pivot_high
else
upper_trendline := nz(upper_trendline) - nz(upper_slope)
This adaptive trendline approach automatically identifies key structural market boundaries, adjusting in real-time to evolving chart patterns.
Breakout State Management
The strategy implements sophisticated state tracking for breakout detection:
// Track breakouts with state variables
var int upper_breakout_state = 0
var int lower_breakout_state = 0
// Update breakout state when price crosses trendlines
upper_breakout_state := bool(pivot_high) ? 0 : close > upper_trendline ? 1 : upper_breakout_state
lower_breakout_state := bool(pivot_low) ? 0 : close < lower_trendline ? 1 : lower_breakout_state
// Detect new breakouts (state transitions)
bool new_upper_breakout = upper_breakout_state > upper_breakout_state
bool new_lower_breakout = lower_breakout_state > lower_breakout_state
This state-based approach enables precise identification of the exact moment when price breaks through a significant trendline.
Multi-Factor Signal Confluence
Entry signals require confirmation from multiple technical factors:
// Define entry conditions with multi-factor confluence
long_entry_condition = enable_long_positions and
upper_breakout_state > upper_breakout_state and // New trendline breakout
di_plus > di_minus and // Bullish DMI confirmation
close > smoothed_trend // Price above Supertrend envelope
// Execute trades only with full confirmation
if long_entry_condition
strategy.entry('L', strategy.long, comment = "LONG")
This strict requirement for confluence significantly reduces false signals and improves the quality of trade entries.
Advanced Risk Management
The strategy includes sophisticated risk controls with multiple methodologies:
// Calculate stop loss based on selected method
get_long_stop_loss_price(base_price) =>
switch stop_loss_method
'PERC' => base_price * (1 - long_stop_loss_percent)
'ATR' => base_price - long_stop_loss_atr_multiplier * entry_atr
'RR' => base_price - (get_long_take_profit_price() - base_price) / long_risk_reward_ratio
=> na
// Implement trailing functionality
strategy.exit(
id = 'Long Take Profit / Stop Loss',
from_entry = 'L',
qty_percent = take_profit_quantity_percent,
limit = trailing_take_profit_enabled ? na : long_take_profit_price,
stop = long_stop_loss_price,
trail_price = trailing_take_profit_enabled ? long_take_profit_price : na,
trail_offset = trailing_take_profit_enabled ? long_trailing_tp_step_ticks : na,
comment = "TP/SL Triggered"
)
This flexible approach adapts to varying market conditions while providing comprehensive downside protection.
Performance Characteristics
Rigorous backtesting demonstrates exceptional capital appreciation potential with impressive risk-adjusted metrics:
Remarkable total return profile (1,517%+)
Strong Sortino ratio (3.691) indicating superior downside risk control
Profit factor of 1.924 across all trades (2.153 for long positions)
Win rate exceeding 35% with balanced distribution across varied market conditions
Institutional Considerations
The strategy architecture addresses execution complexities faced by institutional participants with temporal filtering and date-range capabilities:
// Time Filter settings with flexible timezone support
import jason5480/time_filters/5 as time_filter
src_timezone = input.string(defval = 'Exchange', title = 'Source Timezone')
dst_timezone = input.string(defval = 'Exchange', title = 'Destination Timezone')
// Date range filtering for precise execution windows
use_from_date = input.bool(defval = true, title = 'Enable Start Date')
from_date = input.time(defval = timestamp('01 Jan 2022 00:00'), title = 'Start Date')
// Validate trading permission based on temporal constraints
date_filter_approved = time_filter.is_in_date_range(
use_from_date, from_date, use_to_date, to_date, src_timezone, dst_timezone
)
These capabilities enable precise execution timing and market session optimization critical for larger market participants.
Acknowledgments
Special thanks to LuxAlgo for the pioneering work on trendline detection and breakout identification that inspired elements of this strategy. Their innovative approach to technical analysis provided a valuable foundation upon which I could build my Fibonacci-based methodology.
This strategy is shared under the same Attribution-NonCommercial-ShareAlike 4.0 International (CC BY-NC-SA 4.0) license as LuxAlgo's original work.
Past performance is not indicative of future results. Conduct thorough analysis before implementing any algorithmic strategy.

Bollinger Bands MTF & Kalman Filter | Flux Charts📈 Multi-Timeframe Kalman Filtered Bollinger Bands Indicator
Introducing our MTF Kalman Filtered Bollinger Bands – a powerful multi-timeframe Bollinger Bands (BB) indicator enhanced with Kalman filtering for superior smoothing and trend analysis. This indicator dynamically adapts Bollinger Bands across multiple timeframes while incorporating volume-based gradient transparency to highlight significant price movements. This indicator is better optimized for lower timeframes.
❓ How to Interpret the Bands & Volume Gradient:
Our indicator combines Lower Timeframe (LTF) and Higher Timeframe (HTF) Bollinger Bands to provide a comprehensive trend analysis. It applies Kalman filtering to the LTF bands, ensuring smoother, noise-reduced signals. The color gradient and relative volume-based transparency offer deeper insights into price strength.
🔹 LTF Bollinger Bands: Shorter-period bands filtered with a Kalman smoothing algorithm, reducing lag and noise.
🔹 HTF Bollinger Bands: Traditional Bollinger Bands plotted on a higher timeframe, offering macro trend analysis.
🔹 Volume Gradient Transparency: The bands adjust their opacity based on relative buy/sell volume, allowing traders to assess momentum strength.
📌 How Does It Work?
1️⃣ Multi-Timeframe Bollinger Bands Calculation
The LTF BB uses Kalman filtering for a smoother price representation, helping to reduce false signals.
The HTF BB is EMA-smoothed for improved trend clarity.
2️⃣ Adaptive Gradient Transparency
The opacity of the fill color between the bands is determined by relative buy/sell volume.
Higher buy volume = stronger bullish signal (greener bands).
Higher sell volume = stronger bearish signal (redder bands).
3️⃣ Dynamic Trend Signals & Breakouts
Buy Signal: When price breaks below the HTF lower band and LTF bands start rising.
Sell Signal: When price breaks above the HTF upper band and LTF bands start falling.
⚙️ Settings & Customization:
🛠 LTF and HTF Bollinger Bands Settings:
Multiplier: The multiplier applied to the BB to determine the upper and lower bands
Length: Define the number of bars determines the BB calculations.
Custom Timeframe Selection: Choose from predefined options (e.g., 5m, 15m, 1H, 4H, etc).
🎨 Gradient & Transparency Settings:
Bullish/Bearish Color Options: Customize colors for uptrend and downtrend conditions.
Max & Min Opacity: Adjust the transparency levels based on volume intensity.
Solid vs. Gradient Mode: Choose between a gradient fill or a solid color mode for clarity.
📌 Recommended Settings for Optimal Use:
1️⃣ Timeframe Selection (LTF -> HTF):
1 min -> 5 min
2 min -> 5 min
3 min -> 15 min
5 min -> 15 min
15 min -> 1 hr
1 hr -> 4 hr
4 hr -> 1 day
2️⃣ Multiplier: Use 2.0 for LTF and 2.25 for HTF
3️⃣Length: Use a length of 20 - 30 bars
🚀 Why Use This Indicator?
✅ Multi-Timeframe Bollinger Bands with Kalman Filtering – Ideal for traders looking for reduced lag and clearer trend signals.
✅ Volume-Based Transparency – See momentum shifts instantly with adaptive opacity.
✅ Dynamic Buy & Sell Signals – Alerts based on price action + volume trends.
✅ Customizable for Any Strategy – Adjust colors, timeframes, and filtering options for personalized trading.

Breakouts With Timefilter Strategy [LuciTech]This strategy captures breakout opportunities using pivot high/low breakouts while managing risk through dynamic stop-loss placement and position sizing. It includes a time filter to limit trades to specific sessions.
How It Works
A long trade is triggered when price closes above a pivot high, and a short trade when price closes below a pivot low.
Stop-loss can be set using ATR, prior candle high/low, or a fixed point value. Take-profit is based on a risk-reward multiplier.
Position size adjusts based on the percentage of equity risked.
Breakout signals are marked with triangles, and entry, stop-loss, and take-profit levels are plotted.
moving average filter: Bullish breakouts only trigger above the MA, bearish breakouts below.
The time filter shades the background during active trading hours.
Customization:
Adjustable pivot length for breakout sensitivity.
Risk settings: percentage risked, risk-reward ratio, and stop-loss type.
ATR settings: length, smoothing method (RMA, SMA, EMA, WMA).
Moving average filter (SMA, EMA, WMA, VWMA, HMA) to confirm breakouts.
