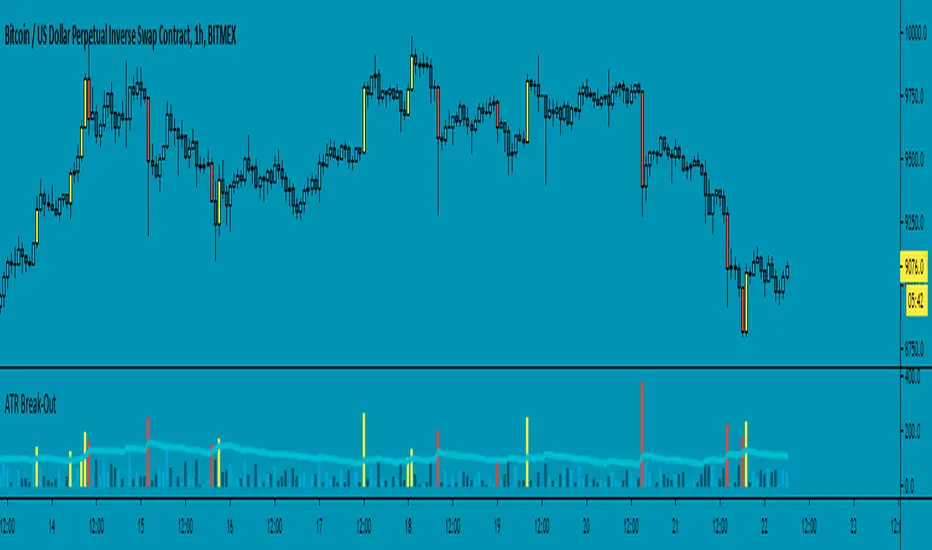
ATR Break-Out - evoThis script measures candle length and average true range (ATR). A break out occurs when a candle is larger than the given ATR value. You can choose to calculate length from wicks or from the body (open & close).
You can use this as trend direction indicator by following the last break out candle or open a position after a break out with a stop just above or below the candle. Enjoy!
Breakout
Ranged Candle Length - evoSimilar to one of my previous scripts 'Ranged Volume', but instead of using volume, this script uses candle length mirrored. It creates a range using highest and lowest of a given period. When the range gets larger, it means the current candle is bigger than the largest candle of your given period (break-out).
Yellow = Bullish break out
Red = Bearish break out
A good way to use this is to follow the direction of the last break-out candle or open a position with a stop just below or above the candle (that's how I tested it real time).
Good luck!

Renko AccelerationRenko is a very useful charting method for analyzing stock movement. It does a great job of filtering out all the excess noise so that all we're left with is pure price action. But, what about time? Time is a fundamental part of chart analysis and we are only seeing part of the picture. After all, shouldn't we take a very different approach to trading signals from a block that renders in 2 seconds as opposed to a block that renders in 30 minutes?
This indicator provides the best of both worlds, enabling us to correlate the passing of time with price movement and clearly see when squeezes and breakouts occur.
As the indicator turns up to green we can see that volatility is on the move and the market is accelerating (breakout), and as it turns down to red the market is stagnating (squeeze). There is also an alternate 'Precise' view which renders the exact time per block for more granular analysis.

Ranged Volume - evoA simple script that shows mirrored regular volume bars with the purpose to show break-outs and low volume ranges, using highest and lowest of a few bars back.
Use Heikin Ashi function to smooth the colors with the trend.

Force IndexWhat is the force index ?
The force index is an oscillator used to confirm price breakout strengths and identify potential trends.
It was popularized by A. Elder.
How the force index is computed ?
Knowing that volume is the fuel of a price movement, reliable breakouts and trend continuation are more likely to occur on high volume breakouts. This is why the force index is computed with the intensity of the price movement, and it's volume , using the formula ema13((close(n) - close(n-1)) * volume ) .
How to use the force index
An important change in the force index indicate a strong momentum in the price action.
You can read more about the force index interpretation on Investopedia
Customization
You can display the indicator as an histogram, or as a line chart.
You can change EMA length, although it's recommended to keep it at default value.

[PX] ADX BoxesHello guys,
today I would like to share an indicator that I had in my mind for quite some time. I call it ADX Boxes.
How does it work?
What the indicator does is very simple. Whenever the ADX falls below a certain threshold (which can be managed in the user input settings) a box will appear. The box will continue to grow as long as the ADX stays below the threshold. Once the ADX goes back above the threshold, the box will stop growing and will set its right border.
There are two modes, which can be used to determine the upper and lower border of the box. The first one is called "Extremes", which plots the borders the highest high and lowest low for the range below the threshold. The second one is called "Avg. High/Low", which plots the borders at the average high and average low within the range.
Furthermore, the indicator contains an option to show the average value of the detected range below the ADX threshold.
Just like all my other indicator scripts, this one comes with different styling options for boxes in progress, settled boxes and the average value.
Hopefully, some of you find it useful.
Make sure you leave a follow and a like :)
Happy trading!!

[RS]The Breakout IndicatorSignals when there is a breakout from the trading range(donchian channel up to 300 bars back).

Fractal Breakout StrategyFractal
A type of pattern used in technical analysis to predict a reversal in the current trend. A fractal pattern consists of five bars and is identified when the price meets the following characteristics:
1. A shift from a downtrend to an uptrend occurs when the lowest bar is located in the middle of the pattern and two bars with successively higher lows are positioned around it.
2. A shift from an uptrend to a downtrend occurs when the highest bar is located in the middle of the pattern and two bars with successively lower highs are positioned around it.

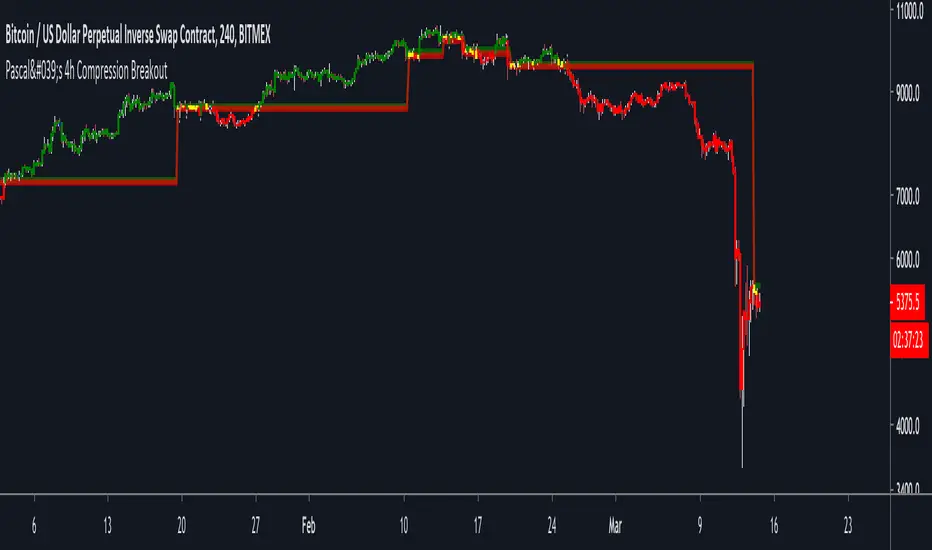
Pascal's 4h Compression BreakoutThis indicator aims to identify areas of price compression, by looking for two consecutive "inside candles" on the 4h chart.
An inside candle is simply when the current candle's high is lower than the previous candle's high, and the current candle's low is higher than the previous candle's low.
Once price compression is identified, the indicator draws a range based on the highest high and the lowest low of the two inside candles.
1) A break above the range is bullish.
2) A break below the range is bearish.
The script ALSO paints candles in blue that are likely to become strong horizontal S/R levels. This is, again, based on a candle pattern.
Please note:
1) This indicator is only meant to be used on BITMEX:XBTUSD (on the 4h or 1h chart).
2) You will have to apply some discretion to profitably trade with this indicator. Use SFPs and horizontal S/R levels to judge if a breakout is worth trading.
Finally, use the indicator at your own risk. I am not responsible for any losses you may incur.
My objective with this indicator g is to hopefully give you something that you can build upon, and NOT a script to blindly copy trade.
The concept of market compression is powerful. There are countless ways in which you can build a system around it.
This is just the tip of the iceberg.
Cheers.
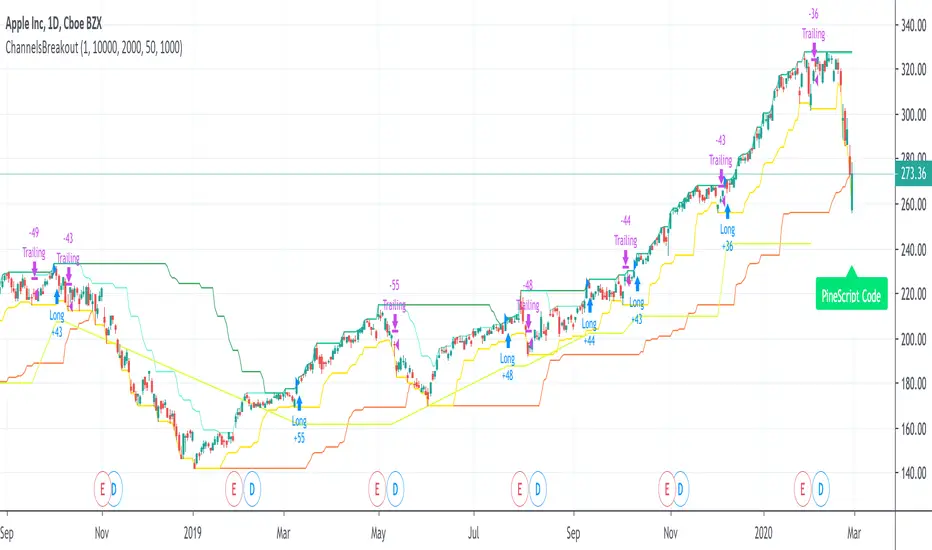
ChannelsBreakoutThis script allows you to intercept price channel breakouts (Donchian channel) in a bullish perspective. Applicable both on Equities/ETFs and on Futures (Index Futures).
We open a position when closes crosses the upper channel. The trade ends with a trailing associated with a fast lower Donchian or a monetary stop loss.
It is an educational code and does not constitute a solicitation for public savings.
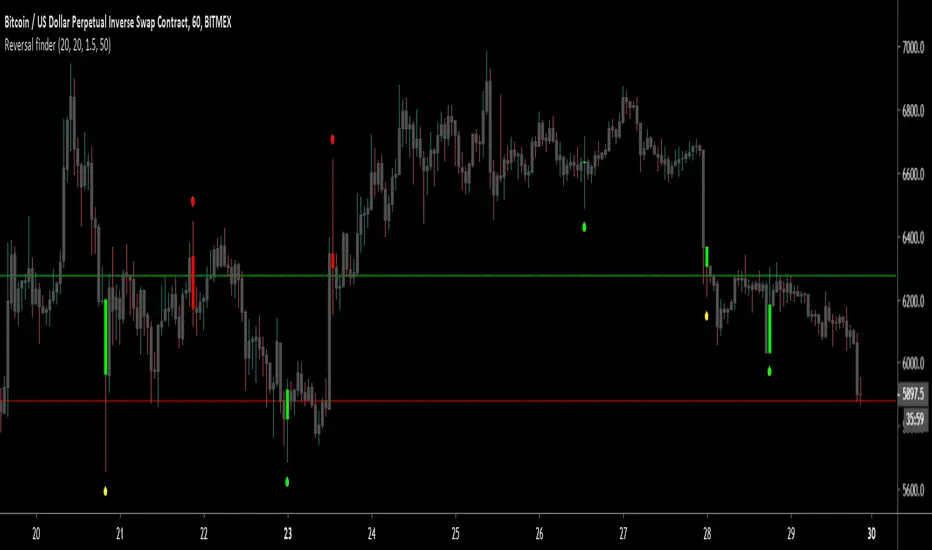
Reversal finderThis script is used to visually highlight candles which may signal a reversal following a false break of a support or resistance level.
Inputs are:
Lookback period: look for the highest high and the lowest low of the prior x bars.
SMA length: used for a simple moving average of the range (high minus low) of the prior x bars.
Range multiple: used to filter out signals for any bars with a range smaller than the average range of the preceding bars (determined by SMA length above) e.g. a range multiple of 2 will only show signals for bars with a range twice of that of the average range of the preceding bars.
Range threshold: used to filter signals for bars both the open and close of the bar are at the extreme end of the bar e.g. a threshold setting of 33% will only show buy signals for bars which open and close within the upper 1/3rd of the bar’s high/low range (vice versa for sell signals). This helps highlight, for example, bars with a high which exceeds resistance in a current range but which close back inside the range.
Highlight signal bars?: This will highlight bars with a buy signal in green, sell signal bars in red, and all other bars in grey. The script was designed for use with a dark background, so you will need to play around with the bar colours in the style settings to suit your preferences.
Settings used in the example chart are not the default – they are lookback: 5, SMA length: 20, range multiple: 1.2, range threshold: 33%.
Enjoy!
Trend Following BreakoutEasy Trend Following Strategy using Highs and Lows breakout of the last X candles to enter and exit trades.
You can easily change the ENTRY and EXIT value in order to find the best settings.
This strategy seems to be working well for $BTC and $ETH on the 4H and 1D.
I didn't play with it too much as I am testing script to trade on the 15 minutes chart with margin. This script can't do this successfully but I hope it can be helpful for what you want to achieve.

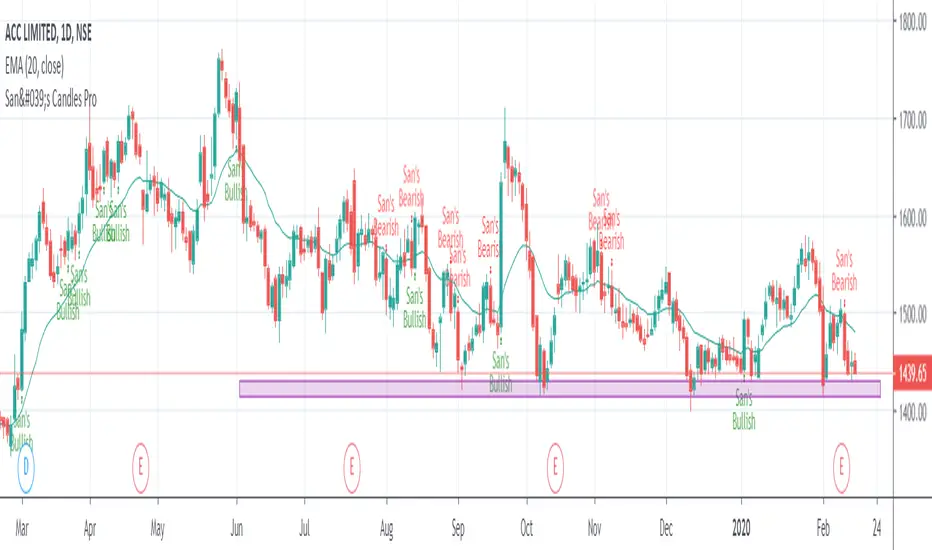
San's Candles ProThe San Trader Candles for bullish and bearish market
- Buy on breaking High of "San's Bullish Candle"
- Sell on breaking Low of "San's Bearish Candle"
Preferred Time Frame: Daily and Weekly
Renko Chart Alerts with PivotsAdd alerts to renko charts to be notified when:
new brick
brick up
brick down
direction change
direction change up
direction change down
Also shows pivots based on brick reversals. Alerts also available for:
pivot breakout
pivot high breakout
pivot low breakout
You can hide the plots for pivot high/low and breakouts in the style tab of the settings for the indicator.
To add the alerts:
add the indicator to your renko chart
click add alert
click the condition dropdown and choose Renko Alerts
you should see all the alerts there and you can add any one or more to your chart

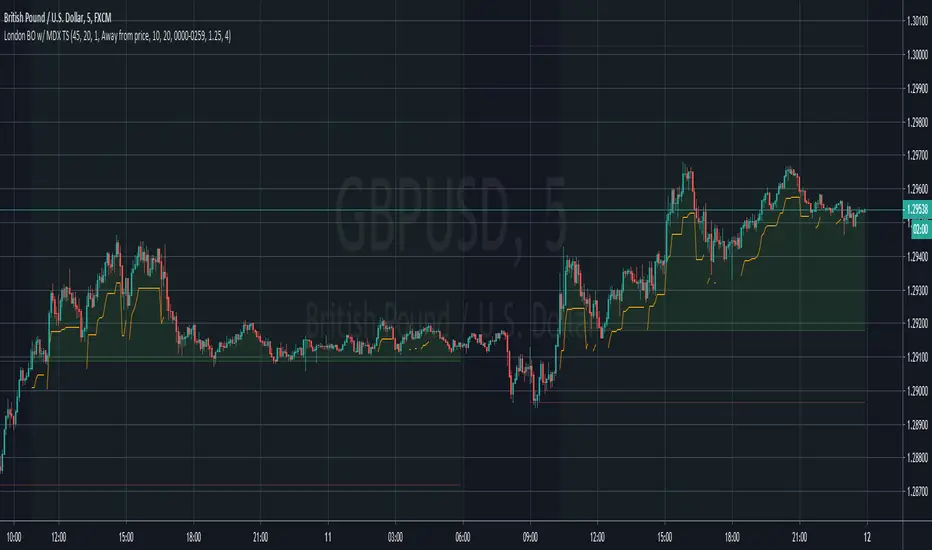
London Breakout with MDX Trailing StopThis indicator aims to aid in using the regular London Breakout strategy, as well as improve on it by adding a trailing stop based on the Mean Deviation Index.
The London Breakout strategy (according to my personal understanding) basically sees the morning before London open as the accumulation or distribution range for large buyers or sellers, and assumes the market will break either above that mornings high or below that mornings low when they start to move price. It is mostly used to trade stock indices and forex.
This indicator plots the morning high and low for each day. The green line is the morning high, and the red line is the morning low. If price moves above the green line (the morning high) it fills that area with a green color. If price moves below the green line (the morning low) it fills that area with a red color. This makes the breakouts easy to spot.
The background color of the chart turns green when the MDX is above 0 (price is more than X times ATR above the mean) and a breakout above the morning high has occurred, and stays green until the opposite happens.
The background color of the chart turns red when the MDX is below 0 (price is more than X times ATR below the mean) and a breakout above the morning high has occurred, and stays green until the opposite happens.
The default for X above is 1.0, but this can be changed in the settings by changing "ATR Multiplier".
The background is always neutral during the morning session since the morning high and morning low are not established yet.
A trailing stop is shown when price is more than X times away from the mean and a breakout has occured. The distance is set using the MDX. The trailing stop uses a separate ATR multiplier though, to make the signal and trailing stop MDX values different, if one likes. The default ATR multiplier for the trailing stop is 1.25, but this can be changed is the settings by changing "ATR multiplier for trailing stop".
When the high or low of a candle breaks the trailing stop, it is moved further away, indicating you have been stopped out, but gives opportunity to use it if you enter again (so it doesn't just disappear).
As an added bonus, take profit levels have been added based on the mornnig range. The take profit distance is set by multiplying the range with a factor. The levels are then plotted that distance from the morning high and morning low.
MDX:
Donchain BreakoutIt is a long only strategy.
1. Buy when price breaks out of the upper band.
2. Exit has two options. Option 1 allows you to exit using lower band. Option 2 allows you to exit using basis line.
3. Slippage and commissions are not considered in the return calculation.

ATR-ranged Donch on 15min// This is a simple Mean Reversion & Breakout Indicator.
// A Donchian Channel is plotted. A threshold equal to 0.25 of Daily ATR.
// If price reverses from this threshold, then it can be taken as possible Mean Reversion.
// If price crosses the previous Donchian levels, it can be taken as a possible breakout.
// Typical of such strategy is the whipsaw effect when price movement is just flat.
// I have marked the region where the lower and higher thresholds are closer to be an indicative of whipsaw.
// But it is not really effective to avoid whipsaw.

BEST Long Term Levels Breakout ScreenerHello traders
Continuing deeper and stronger with the screeners' educational serie one more time (#daft #punk #private #joke)
We don't have to wait for TradingView to allow screener based on custom indicator - we can build our own ^^
I - Long Terms concept
I had the idea from @scarff.
I think it's genius and I use this long terms level in my trading across all assets.
The screener, in particular, analyzes whenever the price breaks out a weekly/monthly/quarterly/yearly level on candle close .
Triggering events on candle close = we get rid of the REPAINTING = we remove the fake signals (in that case the fake breakouts).
The candle close is based on the close of the current chart => if the chart displays candlesticks on the weekly timeframe, then the considered close will be the weekly close.
If in daily timeframe, the close will be .............................. 4h (#wrong)..... kidding :) .............. DAILY obviously
II - How did I set the screener
The visual signals are as follow:
- square: breakout of a high/low weekly level
- circle: breakout of a high/low monthly level
- diamond: breakout of a high/low quarterly level
- flag: breakout of a high/low yearly level
- dash: none of the above
Then the colors are:
- green when bullish
- red when bearish
- orange/dash when none of the above
Cool Hacks
"But sir... what can we do with only 3 instruments for a screener?" I agree not much but...
As said previously... you can add multiple times the same indicator on a chart :)
Wishing you all the BEST trading and.... wait for it... BEST weekend
Dave

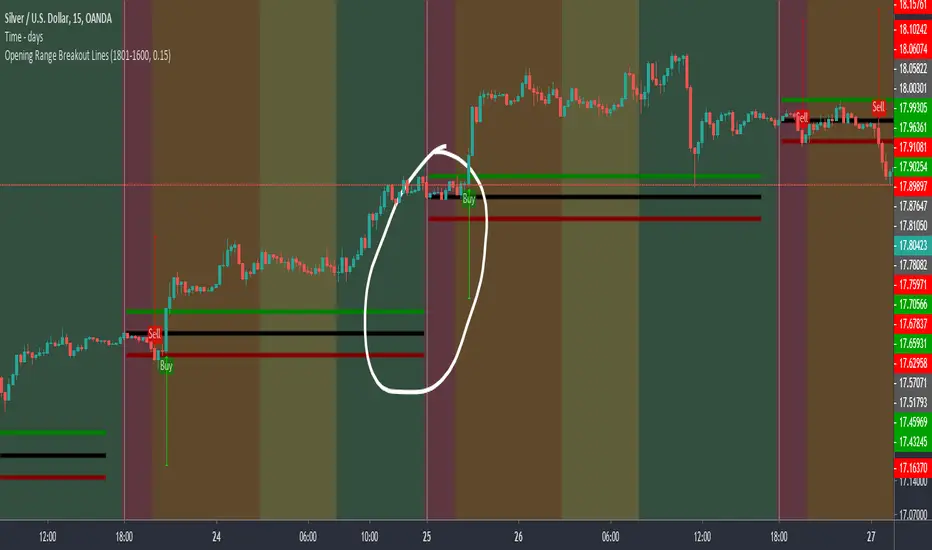
Opening Range Breakout LinesDisclaimer: Use proper risk management and remember that all trading involves risk.
Based on RicardoSantos' "Open Session Breakout Trader Strategy"
I turned it into a study and tweaked it for trading Silver
My goal when creating this was to help visualize breakout lines for multiple trading days at the same time without having to always draw them in.
Extended Recursive Bands - Maximum Efficiency With Extra OptionsIntroducing A New Calculation For Efficient Bands Calculation !
Here it is ! The Recursive Bands Indicator, an indicator specially created to be extremely efficient, i think you already know that calculation time is extra important in algorithmic trading, and this is the principal motivation for the creation of the proposed indicator. Originally described in my paper "Pierrefeu, Alex (2019): Recursive Bands - A New Indicator For Technical Analysis" , the indicator framework has been widely used in my previous uploaded indicators, however it would have been a shame to not upload it, however user experience being a major concern for me, i decided to add extra options, which explain the term "extended".
On The Indicator Calculation
You can skip this part if it doesn't interest you. The calculation of the indicator is based on recursion, but i want to explain the mathematical formula described in the paper.
I've seen some users trying to remake it from the calculations, however there was always something weird, and i understand, mathematical notations are always a bit weird, even myself don't always write them correctly/understand them, however this one is relatively simple to understand.
First lets explain each elements of the calculation :
α = smoothing constant, or 2/(length+1)
max/min = maximum and minimum function, max return the greatest input value while min return the lowest one, for example :
max(4,2) = 4 while min(4,2) = 2
the "||" notation mean taking the absolute value, for example : |-1| = abs(-1) = 1
The calculation after the max/min function is called the correction factor, and is the core of the indicator. The last two variables are just here to provide an initial value for upper and lower, basically when we start our calculations we will assign the value of the closing price for upper and lower.
The motivation behind using a smoothing constant in range of (0,1) was to tell the reader that the indicator is easily made adaptive, this is what i did on my adaptive trailing stop indicator by using the efficiency ratio as smoothing variable, the user can use 1/length instead of the provided calculation for alpha.
If you interested on the indicator main logic, it is actually really simple, by using upper = max(price,upper) and lower = min(price,lower) we would get the maximum/minimum price value at time t , therefore upper can only be greater or equal than its precedent value, while lower can only be lower or equal than its precedent value, in order to fix that we subtract/sum upper/lower with a value, this allow the upper band to be lower than its precedent value and lower to be greater than its precedent value, this is the role of the correction factor.
The Indicator
The indicator display one upper and one lower band, every common usages applied to bands indicators such as support/resistance, breakout, trailing stop...etc, can also be applied to this one. length control how reactive the bands are, higher values of length will make the bands cross the price less often.
In order to provide more flexibility for the user i added the option to use various methods for the calculation of the indicator, therefore the indicator can use the average true range, standard deviation, average high-low range, and one totally exclusive method specially designed for this indicator.
Classic Method
This option make the indicator use its classical calculation, this is the most efficient method of all.
Atr Method (atr)
This method use the average true range as correction factor, notice that lower values of length can still produce wide band.
Standard Deviation Method (stdev)
This method use a biased estimate of the standard deviation as correction factor.
The method produce smoother bands that converge more slowly toward the price in comparison with the classic correction factor.
Average High-Low Range Method (ahlr)
This method use the average of the high-low range as correction factor, extremely similar to the average true range.
Rising Falling Volatility (rfv) Method
A new method created for this indicator, this correction factor use the absolute prices changes when price value is greater/lower than any length past values of the price, this allow to have more boxy shaped bands, work best with greater values of length.
The bands can be in contact with this method, a possible fix in the future.
Conclusion
The recursive band indicator is one of my greatest indicators in my opinion (i would love to have yours), as you can see the idea behind it is extremely simple and allow for a super efficient band indicator, which was the original motivation behind it, in order to provide more fun for the users i also added more option for the correction factor, this allow the user to be creative and not get stuck with the original calculation.
Like the trend step indicator family we have almost ended our series on the recursive band framework, 1 more trailing stop will be added in the future, and then we'll have more "boring" stuff until i find something cool again, it shouldn't be long ;)
Thanks for reading !

Inside Bar Visualizer PineV4I didn't find a study for Inside bar as I wanted. Therefore I wrote a one with PineV4. This may help you to see inside bars.
It can recalculate and works with either (opens-closes) or (highs-lows)
Cheers! :)

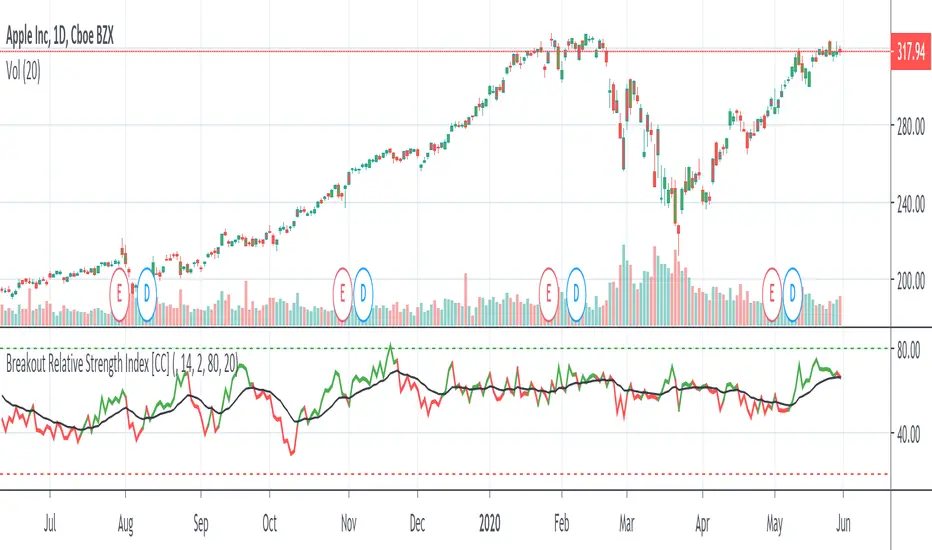
Breakout Relative Strength IndexIt isn't easy to determine if the price of a stock is about to break out. Here’s one way you can determine the relative strength of a breakout, enabling you to act early and realize higher profits.
This indicator was originally developed by Howard Wang Stocks & Commodities V. 33:09 (60–62)