OPEN-SOURCE SCRIPT
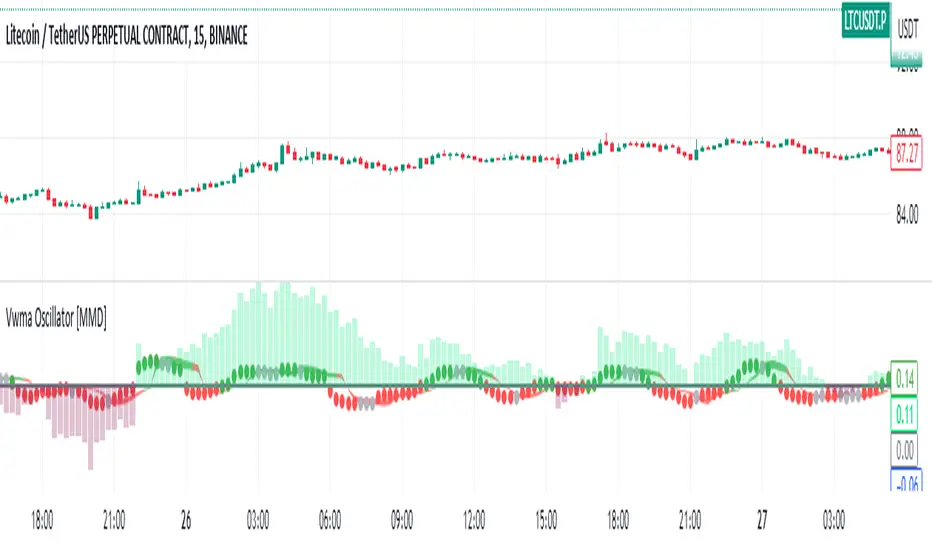
已更新 Vwma Oscillator [MMD]
This line calculates the exponential moving average (EMA) of the product of the close price and volume, divided by the EMA of the volume. The EMA is calculated over a period of 4 bars.
This line calculates the difference between the value of a1 and the volume-weighted moving average (VWMA) of the close price. The VWMA is calculated over a period of 8 bars.
This line calculates a3 as twice the VWMA of a2 over a period of 8 bars, minus the VWMA of a2 over a period of 16 bars.
This line plots the value of a3 on the chart. The color of the plot is determined by the condition inside the color argument. If a3 is within 20% of its previous value (a3[3]) in either direction, the color is set to silver. Otherwise, if a3 is greater than 0, the color is set to green; otherwise, it is set to red. The linewidth parameter sets the thickness of the plot, and the style parameter specifies that circles should be used to plot the values.
These lines plot two horizontal lines on the chart, one at 80% of the previous a3 value (a3[3]*0.8) and the other at 120% of the previous a3 value (a3[3]*1.2). The transp=100 parameter makes the lines transparent. The fill function is then used to fill the area between these lines with either a red or green color, depending on whether a3 at the current bar is greater or smaller than the corresponding values.
This line plots a horizontal line at a value of 0 on the chart. The color is set to gray, and the line width is set to 2.
Overall, this indicator calculates the values of a1, a2, and a3 based on moving averages and
發行說明
Added Sar Ema Columns開源腳本
秉持TradingView一貫精神,這個腳本的創作者將其設為開源,以便交易者檢視並驗證其功能。向作者致敬!您可以免費使用此腳本,但請注意,重新發佈代碼需遵守我們的社群規範。
免責聲明
這些資訊和出版物並非旨在提供,也不構成TradingView提供或認可的任何形式的財務、投資、交易或其他類型的建議或推薦。請閱讀使用條款以了解更多資訊。
免責聲明
這些資訊和出版物並非旨在提供,也不構成TradingView提供或認可的任何形式的財務、投資、交易或其他類型的建議或推薦。請閱讀使用條款以了解更多資訊。