Trend Optimizer
This horizontal trend color and vertical trend bar is a trend identification to optimize your positioning in the market. Colors helps you to understand the trend easily, spontaneously.
The indicators & Strategies?
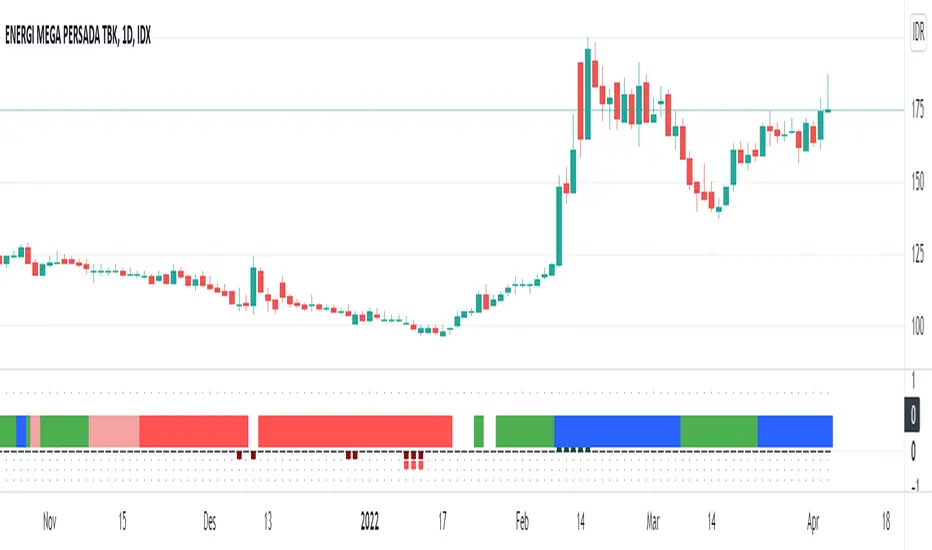
1. A horizontal trend color which represents the medium term trend. The color change is based on the price position towards moving average. We exclude the moving averaged from chart area so the chart area will be clean and you'll have an easier interpretation. This trend color helps you to understand the major trend as simple as you see navigation maps in your smartphone. When the trend color changed from the long red into white, then green, then blue, it indicates a bottom reversal. This module will work best with out other module: Trend Optimizer Module and Momentum line Module.
2. A vertical trend bar represents long term trend. Bars that above the axis is an uptrend bar. If it occurs, the long term bullish trend is exists. Bars below the axis is a downtrend bar. If it occurs, the long term bearish trend is exists. If there is no bars (empty), means the long term trend is weakened but the trend still as same as the last bars occurrence.
Benefit for you:
You'll have a guidance the existing trend and the trend progress from time to time.
If you combine this script with our other two module: Profit Trader module & Momentum Line Module, You'll have a complete template to analyze both trend and swing strategies.
僅限邀請腳本
Only users approved by the author can access this script. You'll need to request and get permission to use it. This is typically granted after payment. For more details, follow the author's instructions below or contact galerisaham directly.
TradingView does NOT recommend paying for or using a script unless you fully trust its author and understand how it works. You may also find free, open-source alternatives in our community scripts.
作者的說明
免責聲明
僅限邀請腳本
Only users approved by the author can access this script. You'll need to request and get permission to use it. This is typically granted after payment. For more details, follow the author's instructions below or contact galerisaham directly.
TradingView does NOT recommend paying for or using a script unless you fully trust its author and understand how it works. You may also find free, open-source alternatives in our community scripts.