OPEN-SOURCE SCRIPT
已更新 Price Altimeter
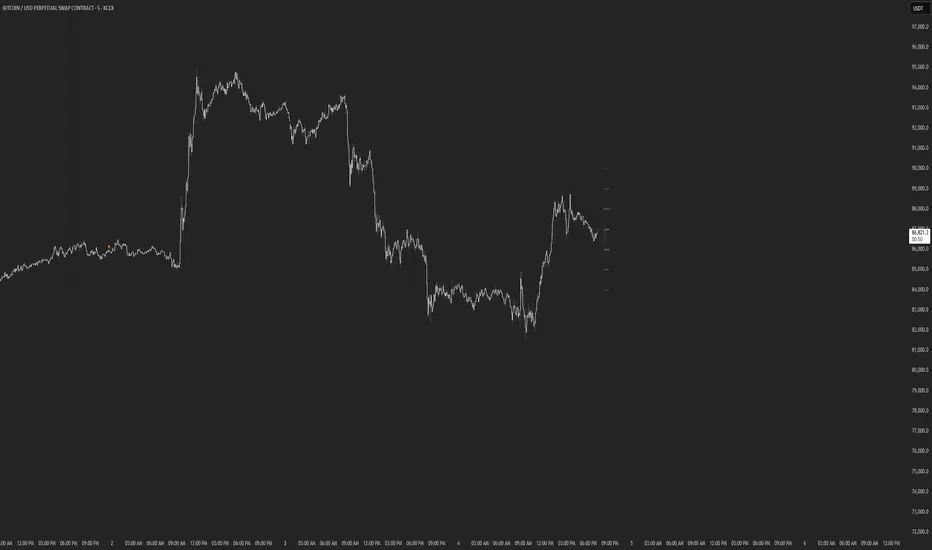
This indicator should help visualize the price, inspired by a Digital Altimeter in a Pilots HUD.
It's by default calibrated to Bitcoin, with the small levels showing every $100 and the larger levels setup to display on every $1000. But you can change this to whatever you want by changing the settings for: Small and Large Level Increments.
The default colors are grey, but can be changed to whatever you want, and there are two cause if you want they work as a gradient.
There are options to fade as the values go away from the current price action.
There are options for Forward and Backward Offsets, 0 is the current price and each value represents a candle on whatever time frame your currently on.
Other Options include the Fade Ratio, the Line Width and Style, which are all self explanatory.
Hope you Enjoy!
Backtest it in fast mode to see it in action a little better...
Known Issues:
For some reason it bug's out when either or are displaying more than 19 lines, unsure why so its limited to that for now.
Extra Note on what this may be useful for: I always wanted to make this, but didn't realize how to put things in front of the price action... Offset! Duh! Anyways, I thought of this one because I often it's hard on these charts to really get an idea for absolute price amounts across different time frames, this in an intuitive, at a glance way to see it because the regular price thing on the right always adds values between values when you zoom in and you can sometimes get lost figuring out the proportions of things.
Could also be useful for Scalping?
發行說明
v1.1Swapped the Negative on Backward Offset to a Positive and updated the defaults so both numbers are now positive and hopefully less confusing.
note: If you already had the script setup and you update, just remove the negative from your settings and it should be what you had it before.
開源腳本
秉持TradingView一貫精神,這個腳本的創作者將其設為開源,以便交易者檢視並驗證其功能。向作者致敬!您可以免費使用此腳本,但請注意,重新發佈代碼需遵守我們的社群規範。
免責聲明
這些資訊和出版物並非旨在提供,也不構成TradingView提供或認可的任何形式的財務、投資、交易或其他類型的建議或推薦。請閱讀使用條款以了解更多資訊。
開源腳本
秉持TradingView一貫精神,這個腳本的創作者將其設為開源,以便交易者檢視並驗證其功能。向作者致敬!您可以免費使用此腳本,但請注意,重新發佈代碼需遵守我們的社群規範。
免責聲明
這些資訊和出版物並非旨在提供,也不構成TradingView提供或認可的任何形式的財務、投資、交易或其他類型的建議或推薦。請閱讀使用條款以了解更多資訊。