OPEN-SOURCE SCRIPT
APEX - RSI with MA [v1]
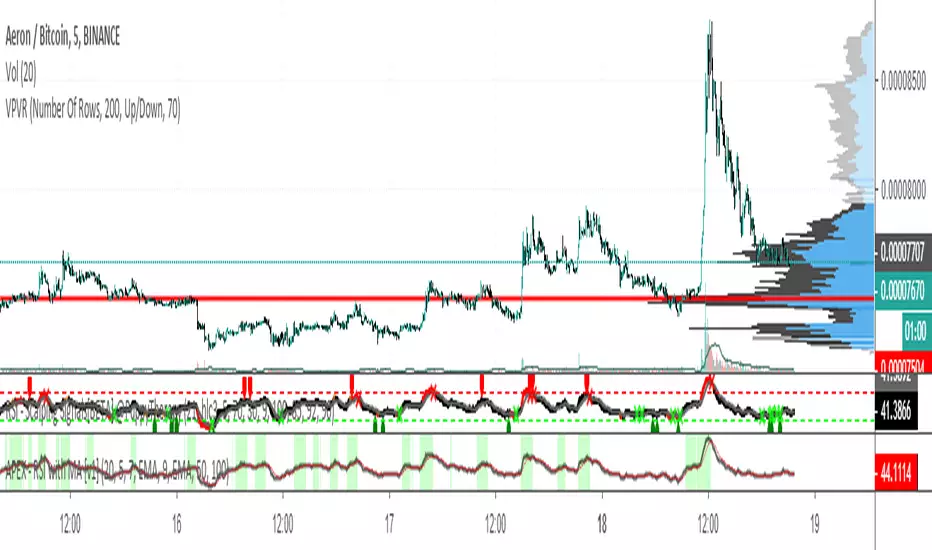
The Relative Strength Index (RSI) is as a momentum oscillator originally developed by J. Welles Wilder. The indicator is calculated as a Ratio of higher closes to lower closes on a scale of 0 to 100.
If the indicator reaches values above 80 (some use 70 or 75) it means the instrument is overbought and if the values are below 20 (25 or 30) it is oversold. But be aware those are just terms oversold/overbought main oversold /overbought for a long time. In general values over 50 mean your instrument is in a bullish state and below 50 it is in a bearish state.
The indicator is most commonly used with the length of 14. Some use RSI in a much more aggressive manner with the length of 2 (also known as Connors RSI). Whereas others have used length up to 20.
Use greater length values on the lower the timeframe to help with the noise. On larger time frames, you should be looking at lower length values.
開源腳本
秉持TradingView一貫精神,這個腳本的創作者將其設為開源,以便交易者檢視並驗證其功能。向作者致敬!您可以免費使用此腳本,但請注意,重新發佈代碼需遵守我們的社群規範。
免責聲明
這些資訊和出版物並非旨在提供,也不構成TradingView提供或認可的任何形式的財務、投資、交易或其他類型的建議或推薦。請閱讀使用條款以了解更多資訊。
開源腳本
秉持TradingView一貫精神,這個腳本的創作者將其設為開源,以便交易者檢視並驗證其功能。向作者致敬!您可以免費使用此腳本,但請注意,重新發佈代碼需遵守我們的社群規範。
免責聲明
這些資訊和出版物並非旨在提供,也不構成TradingView提供或認可的任何形式的財務、投資、交易或其他類型的建議或推薦。請閱讀使用條款以了解更多資訊。