OPEN-SOURCE SCRIPT
已更新 Candles Colored Green/Red According To Buy & Sell Pressure

CANDLES COLORED GREEN OR RED ACCORDING TO BUY & SELL PRESSURE
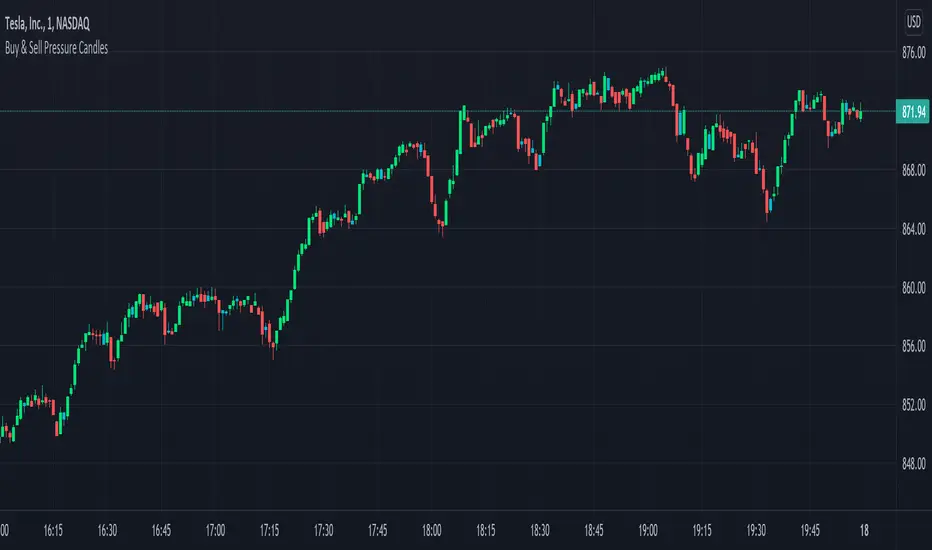
This indicator paints each candle green, red or blue depending on whether the buy/sell pressure for that candle is bullish, bearish or neutral.
***TURN OFF NORMAL CANDLE COLORS***
For this script to show properly on the chart, make sure you go to chart settings(gear icon in top right corner) and in the symbol tab, uncheck body, borders and wick.
***HOW TO USE***
When the directional movement index indicator shows more buying pressure than selling pressure, the candle will appear lime green. This indicates bullish buying pressure.
When the directional movement index indicator shows more selling pressure than buying pressure, the candle will appear red. This indicates bearish selling pressure.
When the directional movement index indicator shows the same amount of buy and sell pressure, the candle will appear blue. This indicates neutral buy/sell pressure.
Use the color changes to see if there is more buying or selling to pinpoint reversals and understand current market buying. Wait to enter or exit positions until the candles turn the opposite color.
***MARKETS***
This indicator can be used as a signal on all markets, including stocks, crypto, futures and forex.
***TIMEFRAMES***
This DMI color coded candlestick indicator can be used on all timeframes.
***TIPS***
Try using numerous indicators of ours on your chart so you can instantly see the bullish or bearish trend of multiple indicators in real time without having to analyze the data. Some of our favorites are our Auto Fibonacci, Directional Movement Index, Color Coded Buy & Sell Pressure Volume Profile, Auto Support And Resistance and Money Flow Index in combination with this Buy & Sell pressure Candle indicator.
發行說明
Removed unnecessary code發行說明
Added info box to tell users how to turn off normal candles.Added ability to turn custom candles on or off for regular candle comparisons.
Added ability to change DMI length and smoothing.
Added ability to change candle colors easily.
開源腳本
秉持TradingView一貫精神,這個腳本的創作者將其設為開源,以便交易者檢視並驗證其功能。向作者致敬!您可以免費使用此腳本,但請注意,重新發佈代碼需遵守我們的社群規範。
Trend Friend - Data Driven Trading Indicators For All Your Favorite Markets
Get Access To Our Premium Indicator Suite -> friendofthetrend.com/
Join Our Trading Group - facebook.com/groups/stockandcryptotradingstrategies
Get Access To Our Premium Indicator Suite -> friendofthetrend.com/
Join Our Trading Group - facebook.com/groups/stockandcryptotradingstrategies
免責聲明
這些資訊和出版物並非旨在提供,也不構成TradingView提供或認可的任何形式的財務、投資、交易或其他類型的建議或推薦。請閱讀使用條款以了解更多資訊。