OPEN-SOURCE SCRIPT
已更新 HTF Liquidity Dashboard [TFO]
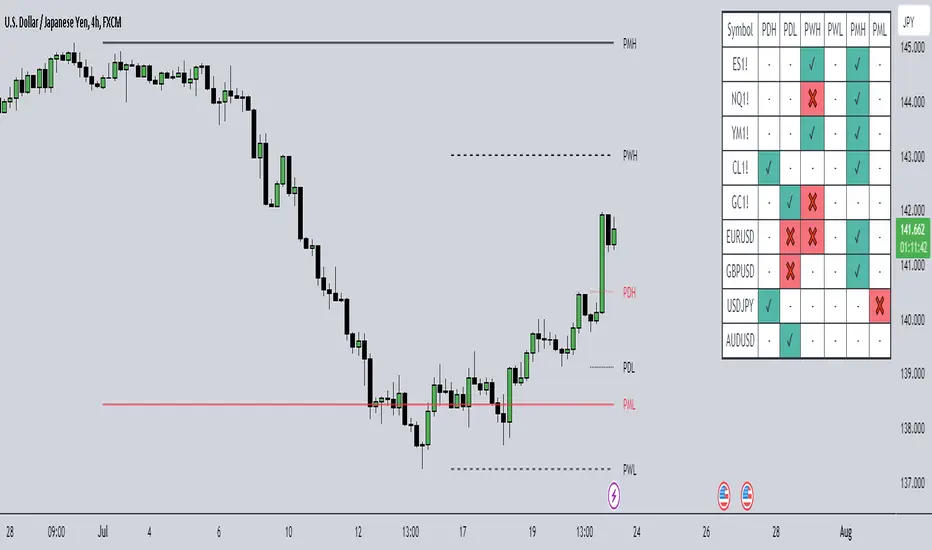
The purpose of this indicator is to server as a multi-symbol scanner that indicates when user-defined symbols have exceeded their previous Day/Week/Month highs and lows.

By default, the dashboard will use a compact view where the green ✔ means that price has swept and is currently exceeding the level of interest, the red ❌ implies that price swept the level but reversed back into the original range, and - indicates that the level hasn't been reached. However, the dashboard text can be toggled to show the numerical values of the highs and lows instead of these compact strings, as shown in the following image.

These levels may be shown and customized on the current chart as well via the Show Levels option. By default, levels from the selected timeframes will initially be plotted as black, and will change to red once traded through. Users can optionally increase the Session Limit parameter to show more than one previous high/low on their chart, for each selected timeframe.

Optionally, we can also plot labels to show when any of the user-defined symbols have exceeded their respective highs and lows, for any of the selected timeframes. Alerts can be created for these events as well; simply select the desired symbols and timeframes, create a new alert using this indicator, and you should be alerted when highs and lows are traded through. Note: if you encounter any issues with duplicate alerts, try deleting the alert, navigating to a lower timeframe such as the 1m, and making a new alert.

By default, the dashboard will use a compact view where the green ✔ means that price has swept and is currently exceeding the level of interest, the red ❌ implies that price swept the level but reversed back into the original range, and - indicates that the level hasn't been reached. However, the dashboard text can be toggled to show the numerical values of the highs and lows instead of these compact strings, as shown in the following image.
These levels may be shown and customized on the current chart as well via the Show Levels option. By default, levels from the selected timeframes will initially be plotted as black, and will change to red once traded through. Users can optionally increase the Session Limit parameter to show more than one previous high/low on their chart, for each selected timeframe.
Optionally, we can also plot labels to show when any of the user-defined symbols have exceeded their respective highs and lows, for any of the selected timeframes. Alerts can be created for these events as well; simply select the desired symbols and timeframes, create a new alert using this indicator, and you should be alerted when highs and lows are traded through. Note: if you encounter any issues with duplicate alerts, try deleting the alert, navigating to a lower timeframe such as the 1m, and making a new alert.
發行說明
Fixed an issue that resulted from very low timeframes not being able to pull certain HTF data發行說明
Applied global text size parameter to sweep labels開源腳本
秉持TradingView一貫精神,這個腳本的創作者將其設為開源,以便交易者檢視並驗證其功能。向作者致敬!您可以免費使用此腳本,但請注意,重新發佈代碼需遵守我們的社群規範。
免責聲明
這些資訊和出版物並非旨在提供,也不構成TradingView提供或認可的任何形式的財務、投資、交易或其他類型的建議或推薦。請閱讀使用條款以了解更多資訊。
開源腳本
秉持TradingView一貫精神,這個腳本的創作者將其設為開源,以便交易者檢視並驗證其功能。向作者致敬!您可以免費使用此腳本,但請注意,重新發佈代碼需遵守我們的社群規範。
免責聲明
這些資訊和出版物並非旨在提供,也不構成TradingView提供或認可的任何形式的財務、投資、交易或其他類型的建議或推薦。請閱讀使用條款以了解更多資訊。