OPEN-SOURCE SCRIPT
已更新 Stochastic RSI with crossover-indication and alerts
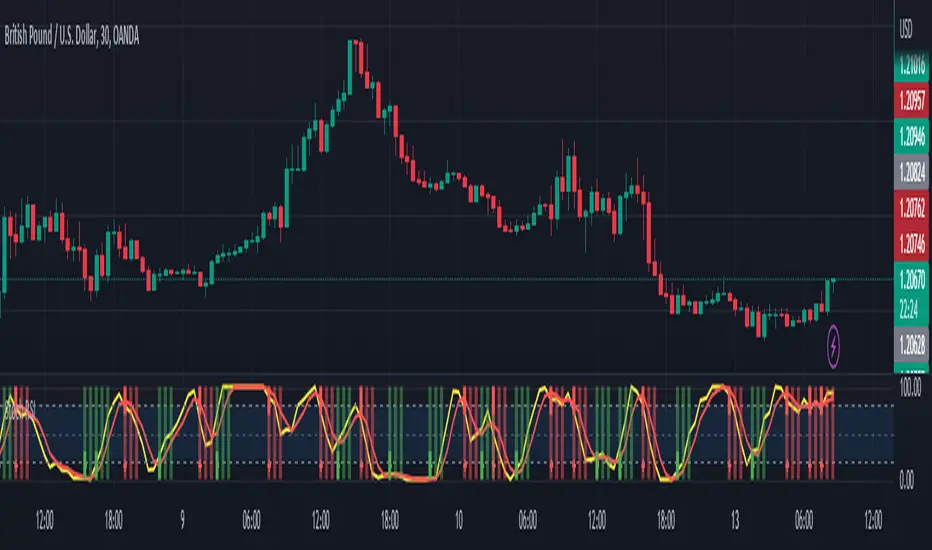
On the normal Stochastic RSI it may be hard to see the exact crosses between the two lines. This version makes that a little easier.
Shows green line when K-line crosses up the D-line, but below the 50-level (this treshold level can be adjusted in the settings).
Shows red line when K-line crosses down the D-line, but above the 50-level (treshold level can be adjusted).
Option to show lines on the subsequent one or two bars. For instance you can use a rule that a crossover is still valid for trade-entry when it happened 2 bars ago.
發行說明
Cleaned up the code.Linewidth can now be adjusted.
In the style-settings you can get rid of the vertical lines, leaving just a tiny cross as an indication where the K and D have crossed.
發行說明
New version can generate alerts with crossover / crossunder,but with additional condition that candle itself is bulllish (green) or bearish (red).發行說明
.開源腳本
秉持TradingView一貫精神,這個腳本的創作者將其設為開源,以便交易者檢視並驗證其功能。向作者致敬!您可以免費使用此腳本,但請注意,重新發佈代碼需遵守我們的社群規範。
免責聲明
這些資訊和出版物並非旨在提供,也不構成TradingView提供或認可的任何形式的財務、投資、交易或其他類型的建議或推薦。請閱讀使用條款以了解更多資訊。
免責聲明
這些資訊和出版物並非旨在提供,也不構成TradingView提供或認可的任何形式的財務、投資、交易或其他類型的建議或推薦。請閱讀使用條款以了解更多資訊。