INVITE-ONLY SCRIPT
Auto Harmonic Terhal
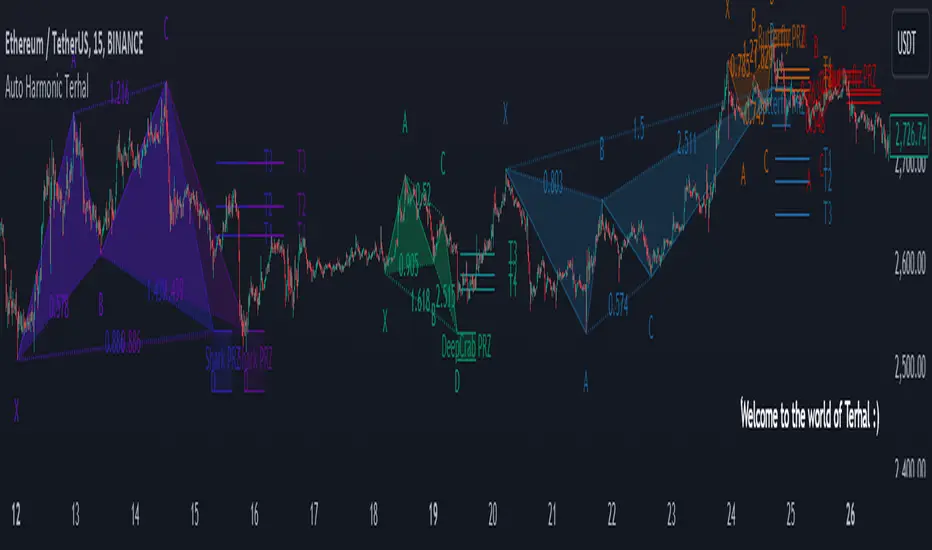
Auto Harmonic Terhal is an advanced harmonic pattern recognition indicator designed to identify a wide range of harmonic patterns and their corresponding Fibonacci retracement levels. This tool is equipped with all major harmonic patterns, including the Gartley, Bat, Crab, DeepCrab, Butterfly, and Shark patterns, along with their precise Fibonacci ratios derived from Scott Carney's Harmonic Trading framework.
Key Features:
Harmonic Patterns: The indicator supports all the essential harmonic patterns, each accompanied by their unique Fibonacci retracement levels, such as 0.382, 0.500, 0.618, 0.786, 0.886, 1.13, 1.618, and 1.902. These ratios are based on Scott Carney's studies.
Predictive and Conventional Usage: The Auto Harmonic Terhal can be used in two ways:
-Predictive: Traders can anticipate harmonic patterns before they are fully formed, allowing them to set up trades in advance.
Conventional: The indicator confirms patterns once they appear, making it a useful tool for pattern validation.
-Accurate Targets: Once a pattern is identified, the indicator displays target levels based on correct Fibonacci ratios, helping traders to locate potential price reversal points and profit targets.
Multi-Zigzag Functionality: The indicator scans for patterns across multiple zigzag configurations, enhancing the detection of different harmonic structures without limiting itself to a single timeframe or zigzag structure.
Fibonacci Ratios for Patterns:
Gartley: XA retracement 61.8%, AB between 0.618 and 0.786, CD 1.272 extension.
Bat: XA retracement 50%, AB 38.2% to 50%, CD 88.6%.
Crab: XA retracement 38.2%, CD extension 161.8%.
Deep Crab: XA retracement 88.6%, CD extension 161.8%.
Butterfly: XA retracement 78.6%, CD extension 127% to 161.8%.
Shark: AB 113% to 161.8%, CD 88.6%.
This indicator serves as a crucial aid for harmonic pattern analysis and supports an essential form of technical analysis. However, it does not recommend buying or selling or making any trade decisions directly. It is meant to assist in harmonic analysis for traders, providing a framework for understanding market reversals and structure.
Note: The tool is intended as a technical analysis assistant and does not provide direct buy or sell signals.
僅限邀請腳本
僅作者批准的使用者才能訪問此腳本。您需要申請並獲得使用許可,通常需在付款後才能取得。更多詳情,請依照作者以下的指示操作,或直接聯絡Bit_Terhal。
TradingView不建議在未完全信任作者並了解其運作方式的情況下購買或使用腳本。您也可以在我們的社群腳本中找到免費的開源替代方案。
作者的說明
direct message "tradingview ".. thank you
免責聲明
這些資訊和出版物並非旨在提供,也不構成TradingView提供或認可的任何形式的財務、投資、交易或其他類型的建議或推薦。請閱讀使用條款以了解更多資訊。
僅限邀請腳本
僅作者批准的使用者才能訪問此腳本。您需要申請並獲得使用許可,通常需在付款後才能取得。更多詳情,請依照作者以下的指示操作,或直接聯絡Bit_Terhal。
TradingView不建議在未完全信任作者並了解其運作方式的情況下購買或使用腳本。您也可以在我們的社群腳本中找到免費的開源替代方案。
作者的說明
direct message "tradingview ".. thank you
免責聲明
這些資訊和出版物並非旨在提供,也不構成TradingView提供或認可的任何形式的財務、投資、交易或其他類型的建議或推薦。請閱讀使用條款以了解更多資訊。