OPEN-SOURCE SCRIPT
AutoFibLevels
Personally I don't like the trouble of drawing fibonacci retracement and extension tolls time and time again, not only human eyes and hands are not as accurate as a computer, but also, you would sit and think : "Hey, which one of these candles is the start of the wave" time and time again.
That is one of the issues, some times you may want to drop more than one fibo on the chart to see where they over lap and that, makes your chart hell to look into.
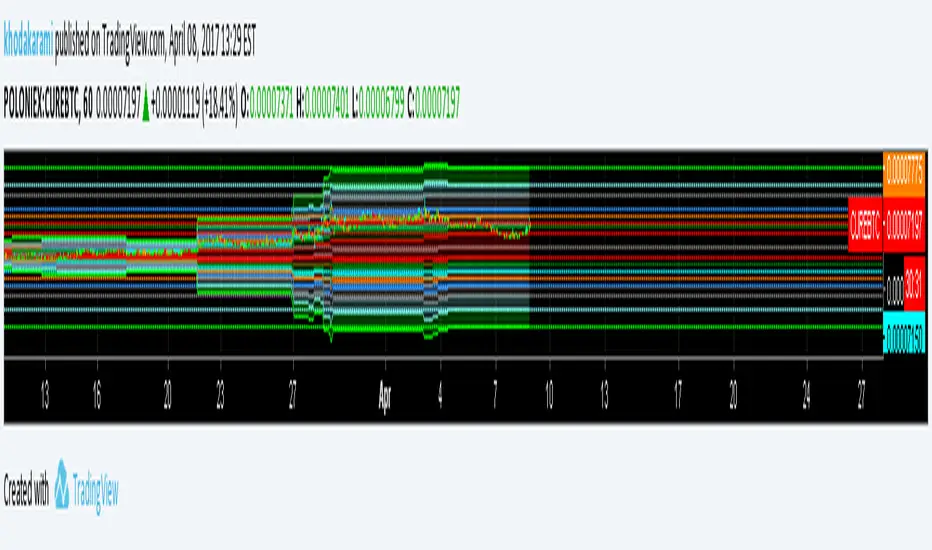
This script will draw fibonacci levels for you based on the time frame you are in, for each time frame the number of bars that it will look into differs and if you need to, you can adjust them per time frame separately.
And as always for indicators, you have total control on which lines to draw and clouds, and their color and transparency.
That is one of the issues, some times you may want to drop more than one fibo on the chart to see where they over lap and that, makes your chart hell to look into.
This script will draw fibonacci levels for you based on the time frame you are in, for each time frame the number of bars that it will look into differs and if you need to, you can adjust them per time frame separately.
And as always for indicators, you have total control on which lines to draw and clouds, and their color and transparency.
開源腳本
秉持TradingView一貫精神,這個腳本的創作者將其設為開源,以便交易者檢視並驗證其功能。向作者致敬!您可以免費使用此腳本,但請注意,重新發佈代碼需遵守我們的社群規範。
免責聲明
這些資訊和出版物並非旨在提供,也不構成TradingView提供或認可的任何形式的財務、投資、交易或其他類型的建議或推薦。請閱讀使用條款以了解更多資訊。
開源腳本
秉持TradingView一貫精神,這個腳本的創作者將其設為開源,以便交易者檢視並驗證其功能。向作者致敬!您可以免費使用此腳本,但請注意,重新發佈代碼需遵守我們的社群規範。
免責聲明
這些資訊和出版物並非旨在提供,也不構成TradingView提供或認可的任何形式的財務、投資、交易或其他類型的建議或推薦。請閱讀使用條款以了解更多資訊。