PROTECTED SOURCE SCRIPT
已更新 Welivvinnlife & ocsabi03 OBV and GNL Hybrid Oscillator
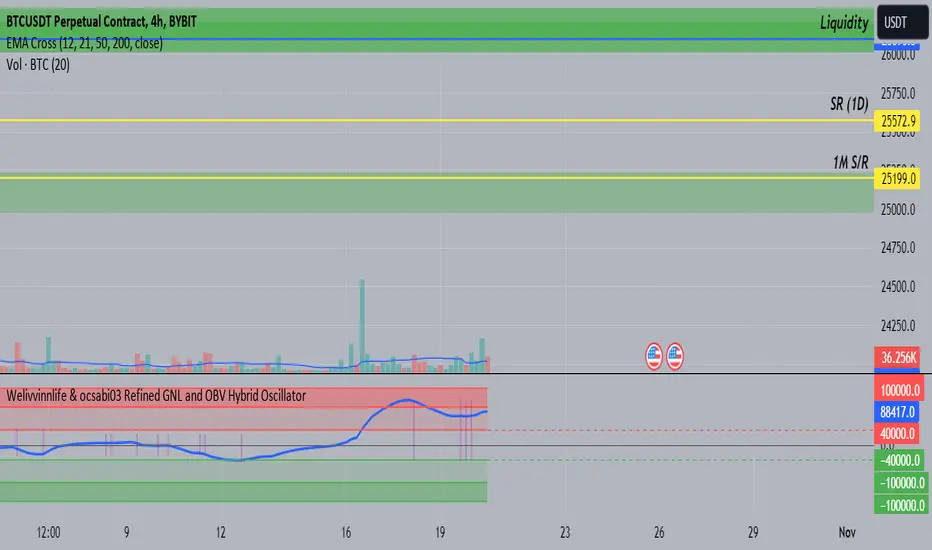
Signal Line (Blue): It gives a smoothed representation of the difference between OBV and GNL. When it moves upwards, it indicates that the recent differences between OBV and GNL are increasing, implying increased bullish momentum. When it moves downwards, it means that the differences are decreasing, suggesting increased bearish momentum.
The purple vertical lines are showing the inflection points of the blue line (if you want to see back in time use replay mode)
the green and red boxes ARE JUST VISUAL AIDS nothing else, not magic, those are the areas where a reversal can happen (not 100% of the time)
THIS IS NOT A MAGIC INDICATOR, ALWAYS USE THIS IN SOME KIND OF SYSTEM
發行說明
-受保護腳本
此腳本以閉源形式發佈。 不過,您可以自由且不受任何限制地使用它 — 在此處了解更多資訊。
免責聲明
這些資訊和出版物並不意味著也不構成TradingView提供或認可的金融、投資、交易或其他類型的意見或建議。請在使用條款閱讀更多資訊。
免責聲明
這些資訊和出版物並不意味著也不構成TradingView提供或認可的金融、投資、交易或其他類型的意見或建議。請在使用條款閱讀更多資訊。