OPEN-SOURCE SCRIPT
UB Profit Signal Indicator
The UB Profit Signal indicator is a technical analysis tool designed to identify potential buy and sell signals in the market. The indicator is based on four technical indicators - Moving Average Convergence Divergence (MACD), Relative Strength Index (RSI), Bollinger Bands (BB), and volume moving average.
The script starts by defining input variables such as MACD Fast Length, MACD Slow Length, MACD Signal Length, RSI Length, etc. These variables are used to customize the indicator based on the user's preference.
The MACD is calculated using the ta.macd function, which returns three variables: the MACD Line, Signal Line, and Histogram. The MACD line is calculated as the difference between two exponential moving averages of the price. The signal line is a moving average of the MACD line. The histogram shows the difference between the MACD line and the signal line.
The RSI is calculated using the ta.rsi function, which calculates the RSI value based on the number of periods specified in the RSI Length input variable. The RSI is a momentum oscillator that measures the speed and change of price movements.
The Bollinger Bands are calculated using the ta.sma and ta.stdev functions. The Simple Moving Average (SMA) is calculated using the close price over 21 periods, while the Standard Deviation is calculated using the close price over the same 21 periods. The upper and lower bands are then calculated based on the SMA and Standard Deviation.
Finally, the buy and sell signals are generated based on specific conditions that combine the MACD, RSI, and BB values. For example, a buy signal is generated when the RSI value is greater than 30, the volume is greater than the volume moving average, the close price is greater than the 9-period SMA, and the close price is between the upper and lower BBs. Similarly, a sell signal is generated when the RSI value is less than 40, the volume is greater than the volume moving average, the close price is less than the 9-period SMA, and the close price is between the upper and lower BBs.
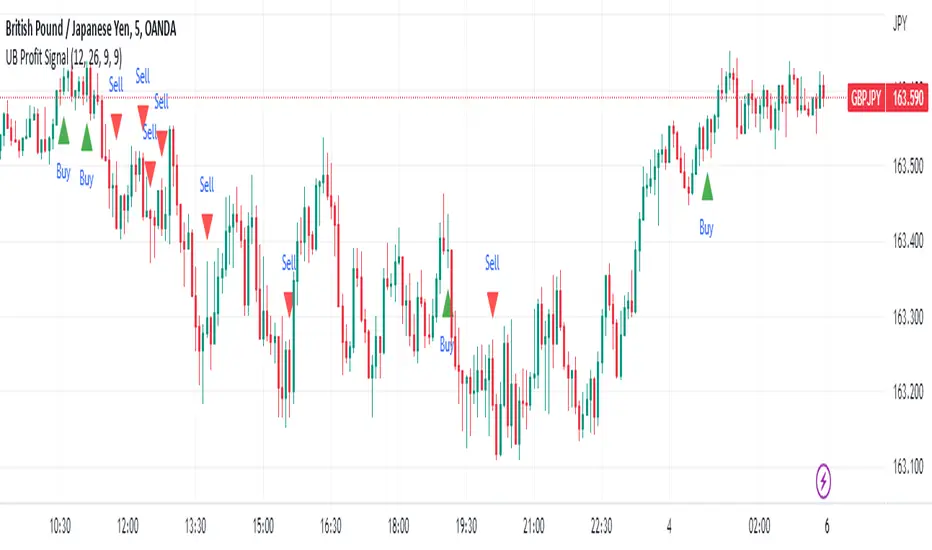
The buy and sell signals are plotted on the chart using the plotshape function, which creates triangular shapes above and below the bars to indicate the signals. Green triangles indicate a buy signal, while red triangles indicate a sell signal. Overall, the UB Profit Signal indicator can be useful for traders looking to identify potential buy and sell signals in the market and take advantage of price movements.
The script starts by defining input variables such as MACD Fast Length, MACD Slow Length, MACD Signal Length, RSI Length, etc. These variables are used to customize the indicator based on the user's preference.
The MACD is calculated using the ta.macd function, which returns three variables: the MACD Line, Signal Line, and Histogram. The MACD line is calculated as the difference between two exponential moving averages of the price. The signal line is a moving average of the MACD line. The histogram shows the difference between the MACD line and the signal line.
The RSI is calculated using the ta.rsi function, which calculates the RSI value based on the number of periods specified in the RSI Length input variable. The RSI is a momentum oscillator that measures the speed and change of price movements.
The Bollinger Bands are calculated using the ta.sma and ta.stdev functions. The Simple Moving Average (SMA) is calculated using the close price over 21 periods, while the Standard Deviation is calculated using the close price over the same 21 periods. The upper and lower bands are then calculated based on the SMA and Standard Deviation.
Finally, the buy and sell signals are generated based on specific conditions that combine the MACD, RSI, and BB values. For example, a buy signal is generated when the RSI value is greater than 30, the volume is greater than the volume moving average, the close price is greater than the 9-period SMA, and the close price is between the upper and lower BBs. Similarly, a sell signal is generated when the RSI value is less than 40, the volume is greater than the volume moving average, the close price is less than the 9-period SMA, and the close price is between the upper and lower BBs.
The buy and sell signals are plotted on the chart using the plotshape function, which creates triangular shapes above and below the bars to indicate the signals. Green triangles indicate a buy signal, while red triangles indicate a sell signal. Overall, the UB Profit Signal indicator can be useful for traders looking to identify potential buy and sell signals in the market and take advantage of price movements.
開源腳本
本著TradingView的真正精神,此腳本的創建者將其開源,以便交易者可以查看和驗證其功能。向作者致敬!雖然您可以免費使用它,但請記住,重新發佈程式碼必須遵守我們的網站規則。
免責聲明
這些資訊和出版物並不意味著也不構成TradingView提供或認可的金融、投資、交易或其他類型的意見或建議。請在使用條款閱讀更多資訊。
開源腳本
本著TradingView的真正精神,此腳本的創建者將其開源,以便交易者可以查看和驗證其功能。向作者致敬!雖然您可以免費使用它,但請記住,重新發佈程式碼必須遵守我們的網站規則。
免責聲明
這些資訊和出版物並不意味著也不構成TradingView提供或認可的金融、投資、交易或其他類型的意見或建議。請在使用條款閱讀更多資訊。