OPEN-SOURCE SCRIPT
Intraday Trend Candles
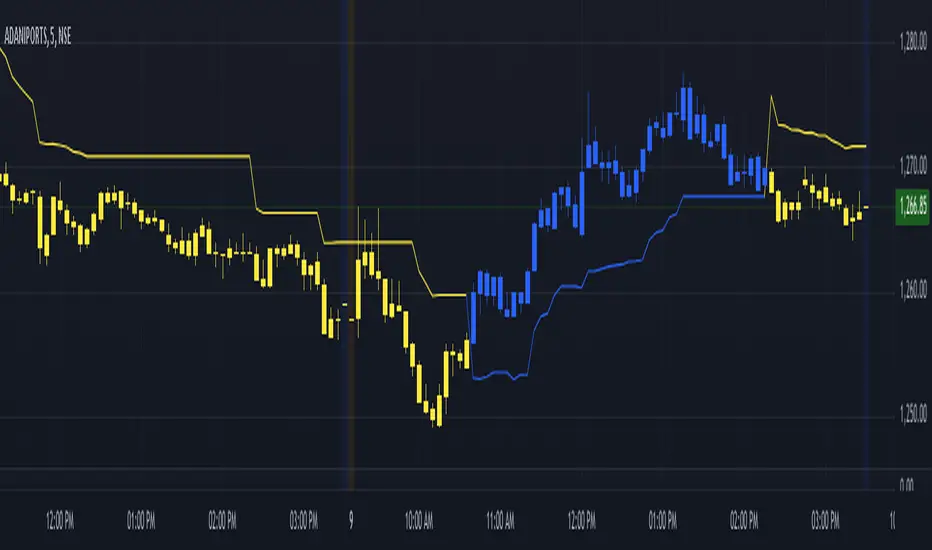
The Intraday Trend Candles (ITC) indicator is a Pine Script-based tool designed for traders seeking to visualize market trends effectively. Using a combination of the Look Back Period, a multiplier for true range, and linearly weighted moving averages (LWMA), this indicator calculates dynamic trend limits that adapt to price movements. It identifies key trend shifts by comparing the current price to these dynamic thresholds, resulting in a visually intuitive display of market bias directly on the chart. The indicator is particularly well-suited for intraday trading, as it provides responsive insights tailored to short-term price action.
The ITC plots color-coded candles, highlighting bullish trends in blue and bearish trends in yellow, with gray indicating indecision or trend continuation. This color-coded approach makes it easy to identify reversals and trend dynamics at a glance. Additionally, a trend line is plotted to enhance clarity, signaling whether the price is favoring the upper or lower threshold of the calculated range. With built-in alerts for trend reversals, traders can stay informed about critical market shifts without constantly monitoring the chart. This combination of visual cues and alerts makes the ITC a versatile and powerful tool for traders focusing on momentum and trend-following strategies.
The ITC plots color-coded candles, highlighting bullish trends in blue and bearish trends in yellow, with gray indicating indecision or trend continuation. This color-coded approach makes it easy to identify reversals and trend dynamics at a glance. Additionally, a trend line is plotted to enhance clarity, signaling whether the price is favoring the upper or lower threshold of the calculated range. With built-in alerts for trend reversals, traders can stay informed about critical market shifts without constantly monitoring the chart. This combination of visual cues and alerts makes the ITC a versatile and powerful tool for traders focusing on momentum and trend-following strategies.
開源腳本
秉持TradingView一貫精神,這個腳本的創作者將其設為開源,以便交易者檢視並驗證其功能。向作者致敬!您可以免費使用此腳本,但請注意,重新發佈代碼需遵守我們的社群規範。
免責聲明
這些資訊和出版物並非旨在提供,也不構成TradingView提供或認可的任何形式的財務、投資、交易或其他類型的建議或推薦。請閱讀使用條款以了解更多資訊。
免責聲明
這些資訊和出版物並非旨在提供,也不構成TradingView提供或認可的任何形式的財務、投資、交易或其他類型的建議或推薦。請閱讀使用條款以了解更多資訊。