OPEN-SOURCE SCRIPT
已更新 X.Y Format Candle Volume & Compression
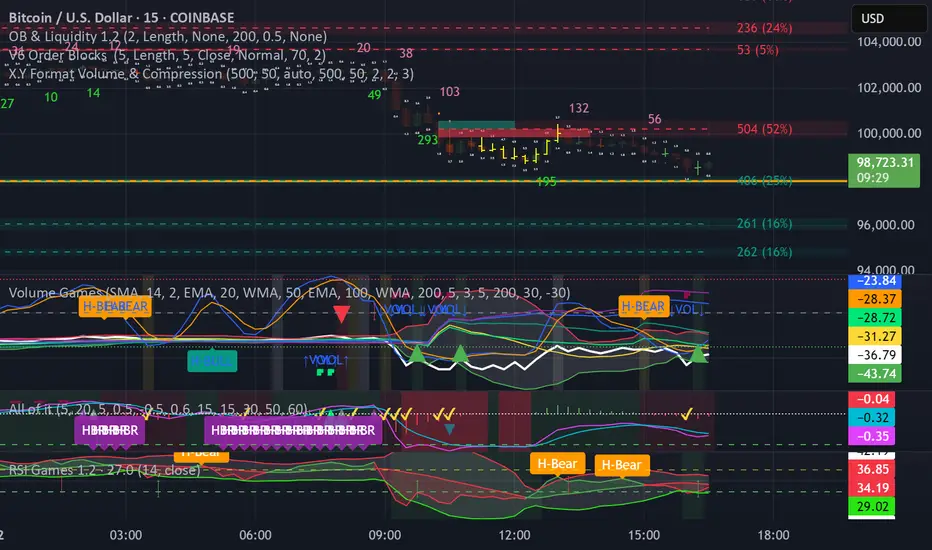
The Volume & Compression Indicator is designed to help traders identify significant market moves by displaying two key metrics above each candle. The top number represents the Volume Ratio, which compares the current candle's volume to the average volume of recent candles. For example, a reading of 2.5 means the current volume is 2.5 times higher than average. When volume exceeds 9.9 times the average, the indicator displays an up or down arrow instead of a number, indicating extremely high volume in that direction.
The bottom number shows the Compression Ratio, which measures the relationship between volume and price movement. This helps identify when large amounts of volume are moving price significantly (low compression) versus when high volume isn't resulting in much price movement (high compression). High compression often indicates accumulation or distribution phases, while low compression with high volume typically suggests strong directional moves.
The indicator includes visual cues to help spot patterns. Dots appear above candles when both high volume and high compression persist over several candles, potentially indicating accumulation phases. Arrows mark possible pivot points after these accumulation periods. Additionally, the candles themselves can display a gradient color that intensifies with increased compression, making it easier to spot areas of interest.
For trading purposes, watch for volume spikes (top number above 2.0) as they can signal potential reversal points or confirm breakouts. High compression readings might precede breakouts, while low compression with high volume often confirms strong trend moves. The most significant signals often come when both metrics show high readings over multiple candles, suggesting sustained institutional interest.
發行說明
This updated version corrects some issues with spacing and calculations.It also allows to disable trim for both volume and compression as well as select auto for the font size.
開源腳本
秉持TradingView一貫精神,這個腳本的創作者將其設為開源,以便交易者檢視並驗證其功能。向作者致敬!您可以免費使用此腳本,但請注意,重新發佈代碼需遵守我們的社群規範。
免責聲明
這些資訊和出版物並非旨在提供,也不構成TradingView提供或認可的任何形式的財務、投資、交易或其他類型的建議或推薦。請閱讀使用條款以了解更多資訊。
開源腳本
秉持TradingView一貫精神,這個腳本的創作者將其設為開源,以便交易者檢視並驗證其功能。向作者致敬!您可以免費使用此腳本,但請注意,重新發佈代碼需遵守我們的社群規範。
免責聲明
這些資訊和出版物並非旨在提供,也不構成TradingView提供或認可的任何形式的財務、投資、交易或其他類型的建議或推薦。請閱讀使用條款以了解更多資訊。