PROTECTED SOURCE SCRIPT
Multi-Timeframe Fibonacci + Open Levels
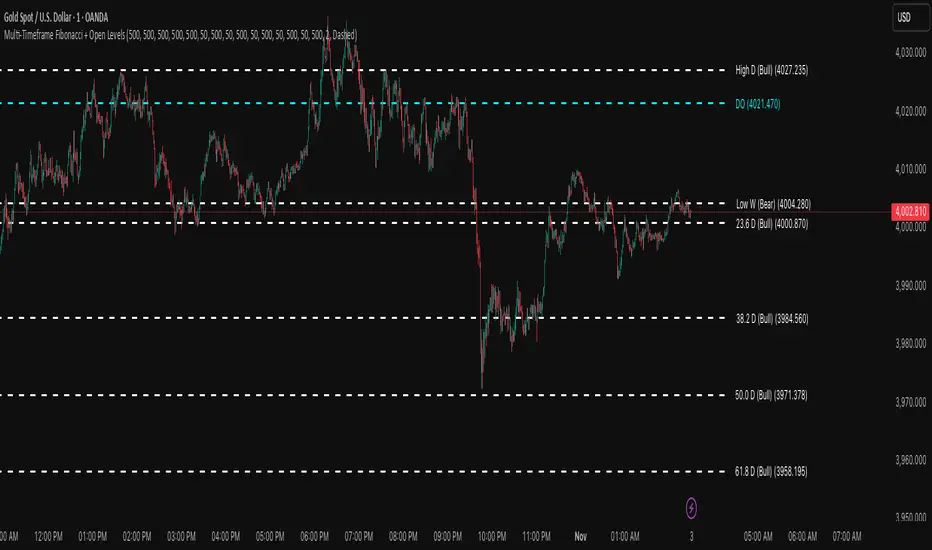
🟣 Multi-Timeframe Fibonacci Levels + Open Levels | Trade Symmetry
This indicator automatically plots Fibonacci levels derived from higher timeframe candle ranges — all at once, directly on your current chart.
It helps you quickly visualize confluence zones and reaction levels where institutional traders are likely to participate.
⚙️ Features
✅ Multi-timeframe Fibonacci Levels — Daily, Weekly, Monthly, Quarterly & Yearly
✅ Automatic Bullish/Bearish detection based on previous candle
✅ Dynamic overlap detection (combines overlapping Fib levels into a single clean label)
✅ Configurable Fibonacci levels, colors, and styles
✅ Optional Open-Price Levels (Daily, Weekly, Monthly)
✅ Clean memory management to keep your chart lightweight
🧠 How to Use
• Add it to any timeframe — it will automatically overlay higher timeframe Fibs.
• Use overlapping or aligned Fib zones as confluence areas.
• Combine with structure or liquidity indicators for high-probability setups.
💡 Inspired by
The concept of higher-timeframe Fibonacci confluences used in Smart Money Concepts (SMC) and ICT-style analysis.
受保護腳本
此腳本以閉源形式發佈。 不過,您可以自由使用,沒有任何限制 — 點擊此處了解更多。
免責聲明
這些資訊和出版物並非旨在提供,也不構成TradingView提供或認可的任何形式的財務、投資、交易或其他類型的建議或推薦。請閱讀使用條款以了解更多資訊。
受保護腳本
此腳本以閉源形式發佈。 不過,您可以自由使用,沒有任何限制 — 點擊此處了解更多。
免責聲明
這些資訊和出版物並非旨在提供,也不構成TradingView提供或認可的任何形式的財務、投資、交易或其他類型的建議或推薦。請閱讀使用條款以了解更多資訊。