PROTECTED SOURCE SCRIPT
MBDOM EMACROSS 5_13 with BB_EMA & Multi-Timeframe
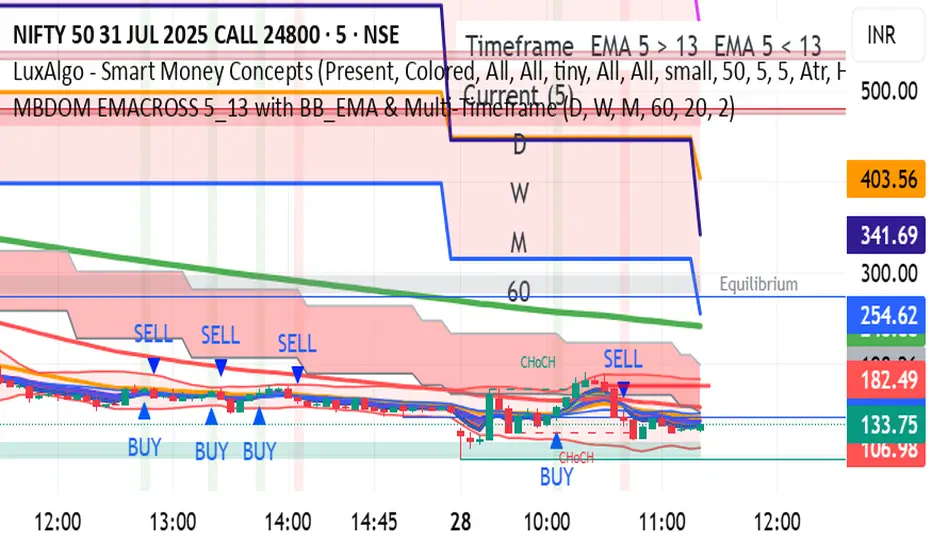
"MBDOM EMACROSS 5_13 with BB_EMA & Multi-Timeframe"
This Pine Script indicator is designed for multi-timeframe trend analysis using EMA crossovers (5 & 13) along with Bollinger Bands (BB) for additional confirmation.
Key Features:
Multi-Timeframe EMA Analysis
Tracks EMA 5 & 13 crossovers across higher (D, W, M) and lower (60min) timeframes.
Displays a summary table showing bullish (✓) or bearish (✓) signals for each timeframe.
EMA Crossovers (Current Chart)
Plots EMA 5, 9, 13, 21, 50, and 200 for trend identification.
Fills between EMA 5 & 13 (green if bullish, red if bearish).
Generates BUY/SELL signals when EMA 5 crosses above/below EMA 13.
Bollinger Bands (BB)
Plots BB (20-period, 2x multiplier) with upper/lower bands and a moving average basis.
Alerts & Visual Enhancements
Triggers alerts for EMA 5/13 crossovers.
Uses background color changes to highlight bullish/bearish conditions.
Use Case:
Helps traders confirm trends across multiple timeframes.
Provides entry/exit signals based on EMA crossovers.
Combines trend-following (EMA) and volatility (BB) indicators.
This script is useful for swing traders and trend followers who rely on multi-timeframe confluence for decision-making.
受保護腳本
此腳本以閉源形式發佈。 不過,您可以自由且不受任何限制地使用它 — 在此處了解更多資訊。
免責聲明
這些資訊和出版物並不意味著也不構成TradingView提供或認可的金融、投資、交易或其他類型的意見或建議。請在使用條款閱讀更多資訊。
受保護腳本
此腳本以閉源形式發佈。 不過,您可以自由且不受任何限制地使用它 — 在此處了解更多資訊。
免責聲明
這些資訊和出版物並不意味著也不構成TradingView提供或認可的金融、投資、交易或其他類型的意見或建議。請在使用條款閱讀更多資訊。