INVITE-ONLY SCRIPT
已更新 Supply & Demand Zones (Order Block) Pro [BacktestBot]
Supply & Demand Zones (Order Block) Pro with DBD/RBR/RBD/DBR/FVG
This indicator helps to identify large price moves driven by banks and institutions. It can be used for any asset type (FOREX, crypto, commodities, indices) and any timeframe.
How to use this indicator
Message me to gain access. I try to reply within 24 hours.
⭑⭑⭑ Zones ⭑⭑⭑

How are zones created?
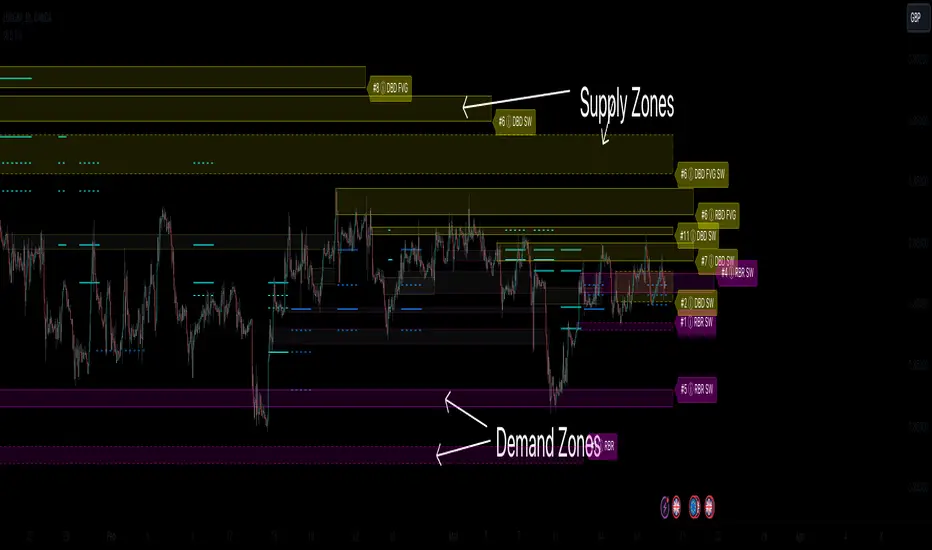
Supply zones are created when the price drops quickly, so are found above the price action.
Demand zones are created when the price rallies quickly, so are found below the price action.
The script uses a combination of quick price movements and user defined minimum price % changes. All user defined settings have default settings which vary depending on asset type and timeframe.
What is a strong zone?
The zones boxes have either a dashed border or a solid border. A solid border represents a strong zone which is when
What is a deactivated zone?
When the price has gone through the zone by a certain %, the zone is deactivated and displayed in a more transparant colour.
How are deactivated zones used for switch zones?
When a new zone is created, it is checked to see if it overlaps a recently deactivated zone.
e.g. If a new demand zone overlaps a recently deactivated supply zone, then the zone has switched from supply to demand. This might mean the new zone could be a strong one and the number of hits on the previous zone (also a potential indicator of strength) is displayed in the zone label tooltip.
Zone information

Zone height
Users have the option of choosing
The indicator does its best to meet the user preference but sometimes it is not possible. The information in the label tooltip will show if the preference was matched.
Minimum and maximum height default settings help to prevent zone boxes which might fill the whole chart.
⭑⭑⭑ Lines of Interest ⭑⭑⭑

Lines of interest are displayed as an added bonus.
Long wick
Long wicks might show areas of support or resistance. Very long and long wicks are defined by the % change in the wicks.
Very long wick lines are always displayed, and long wicks are displayed if they are not near a zone.
Possible Support / Resistance
After a big rally or drop, lines are displayed to show where the price might pullback to. These lines can act as possible support or resistance, and
are taken from recently deactivated zones. A solid line respresents a strong deactivated zone.
⭑⭑⭑ Alerts ⭑⭑⭑
Limit the number of alerts to the recommended ones. Consider this as more of a visual aid to add to your confluences.
Alert types
Alert display
Alerts can be displayed on the chart with symbols. The most recent symbols have a tooltip which allow alert information to be displayed when hovering over them.
It is recommended to turn the alert display off, as it can clutter up the chart. The alerts will continue to work with the display off.
⭑⭑⭑ Example of use ⭑⭑⭑
Side by side chart with different timeframes

⭑⭑⭑ Disclaimer ⭑⭑⭑
Trading is very high risk. All content, tools and scripts provided by BacktestBot are for informational & educational purposes only. Past performance does not guarantee future results.
This indicator helps to identify large price moves driven by banks and institutions. It can be used for any asset type (FOREX, crypto, commodities, indices) and any timeframe.
How to use this indicator
Message me to gain access. I try to reply within 24 hours.
- Consider this as more of a visual aid to add to your confluences.
- Use a side by side chart layout with different timeframes to see more zones.
(See example of use at the bottom) - Pullback trades are popular with zones.
⭑⭑⭑ Zones ⭑⭑⭑
How are zones created?
Supply zones are created when the price drops quickly, so are found above the price action.
Demand zones are created when the price rallies quickly, so are found below the price action.
The script uses a combination of quick price movements and user defined minimum price % changes. All user defined settings have default settings which vary depending on asset type and timeframe.
What is a strong zone?
The zones boxes have either a dashed border or a solid border. A solid border represents a strong zone which is when
- the price has moved very quickly from it, or
- the price has bounced off the zone multiple times.
What is a deactivated zone?
When the price has gone through the zone by a certain %, the zone is deactivated and displayed in a more transparant colour.
How are deactivated zones used for switch zones?
When a new zone is created, it is checked to see if it overlaps a recently deactivated zone.
e.g. If a new demand zone overlaps a recently deactivated supply zone, then the zone has switched from supply to demand. This might mean the new zone could be a strong one and the number of hits on the previous zone (also a potential indicator of strength) is displayed in the zone label tooltip.
Zone information
- Basic zone information can be found in the zone label.
Users can choose what information is displayed in the label including the number of hits and prices. - More detailed information can be found in the zone label tooltip.
Hovering over the label will display more information including the zone start time and height %. - DBD/RBR/RBD/DBR/FVG
Zones are defined as drop base drop, rally base rally, rally base drop, drop base rally, and fair value gap.
Zone height
Users have the option of choosing
- Wick to wick, or
- Wick to body
The indicator does its best to meet the user preference but sometimes it is not possible. The information in the label tooltip will show if the preference was matched.
Minimum and maximum height default settings help to prevent zone boxes which might fill the whole chart.
⭑⭑⭑ Lines of Interest ⭑⭑⭑
Lines of interest are displayed as an added bonus.
Long wick
Long wicks might show areas of support or resistance. Very long and long wicks are defined by the % change in the wicks.
Very long wick lines are always displayed, and long wicks are displayed if they are not near a zone.
Possible Support / Resistance
After a big rally or drop, lines are displayed to show where the price might pullback to. These lines can act as possible support or resistance, and
are taken from recently deactivated zones. A solid line respresents a strong deactivated zone.
⭑⭑⭑ Alerts ⭑⭑⭑
Limit the number of alerts to the recommended ones. Consider this as more of a visual aid to add to your confluences.
Alert types
- Early alerts happen immediately.
- Bar end alerts happen when the bar closes.
Alert display
Alerts can be displayed on the chart with symbols. The most recent symbols have a tooltip which allow alert information to be displayed when hovering over them.
It is recommended to turn the alert display off, as it can clutter up the chart. The alerts will continue to work with the display off.
⭑⭑⭑ Example of use ⭑⭑⭑
Side by side chart with different timeframes
⭑⭑⭑ Disclaimer ⭑⭑⭑
Trading is very high risk. All content, tools and scripts provided by BacktestBot are for informational & educational purposes only. Past performance does not guarantee future results.
發行說明
- *** IMPORTANT CONTACT DETAILS ***
Message me for access using the contact details in my signature
(found at the bottom of this description) - Added Crypto factor to settings
發行說明
- Improved default zone deactivation setting
- Added max hit option to Early Alert 3
發行說明
- Small adjustment to zone height
發行說明
- Front chart change
僅限邀請腳本
只有經作者批准的使用者才能訪問此腳本。您需要申請並獲得使用權限。該權限通常在付款後授予。如欲了解更多詳情,請依照以下作者的說明操作,或直接聯絡BacktestBot。
除非您完全信任其作者並了解腳本的工作原理,否則TradingView不建議您付費或使用腳本。您也可以在我們的社群腳本中找到免費的開源替代方案。
作者的說明
Message me using the contact details in my profile (at the bottom of the indicator description).
I will reply within 24 hours.
提醒:在請求訪問權限之前,請閱讀僅限邀請腳本指南。
Add me as a friend on Discord or email me.
Discord username: backtestbot
Email: hi@backtestbot.com
Discord username: backtestbot
Email: hi@backtestbot.com
免責聲明
這些資訊和出版物並不意味著也不構成TradingView提供或認可的金融、投資、交易或其他類型的意見或建議。請在使用條款閱讀更多資訊。