OPEN-SOURCE SCRIPT
已更新 Relative Strength Comparator
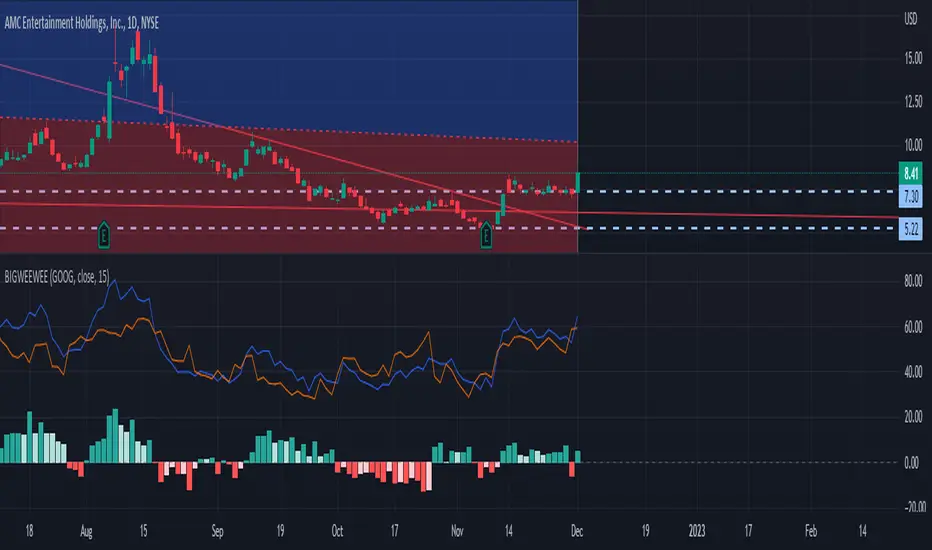
Basically just plots the RSI and the RSI of another stock you pick. Then subtracts the two and makes a histogram showing who's winning.
發行說明
Fixed some of the names because yes I did copy paste from a MACD indicator.發行說明
its the big weewee 2.0Yellow line is macd histogram of your stonk - the macd histogram of the stonk you select.
開源腳本
秉持TradingView一貫精神,這個腳本的創作者將其設為開源,以便交易者檢視並驗證其功能。向作者致敬!您可以免費使用此腳本,但請注意,重新發佈代碼需遵守我們的社群規範。
免責聲明
這些資訊和出版物並非旨在提供,也不構成TradingView提供或認可的任何形式的財務、投資、交易或其他類型的建議或推薦。請閱讀使用條款以了解更多資訊。
免責聲明
這些資訊和出版物並非旨在提供,也不構成TradingView提供或認可的任何形式的財務、投資、交易或其他類型的建議或推薦。請閱讀使用條款以了解更多資訊。