OPEN-SOURCE SCRIPT
Dynamic Cycle Oscillator [Quantigenics]
This script is designed to navigate through the ebbs and flows of financial markets. At its core, this script is a sophisticated yet user-friendly tool that helps you identify potential market turning points and trend continuations.
How It Works:
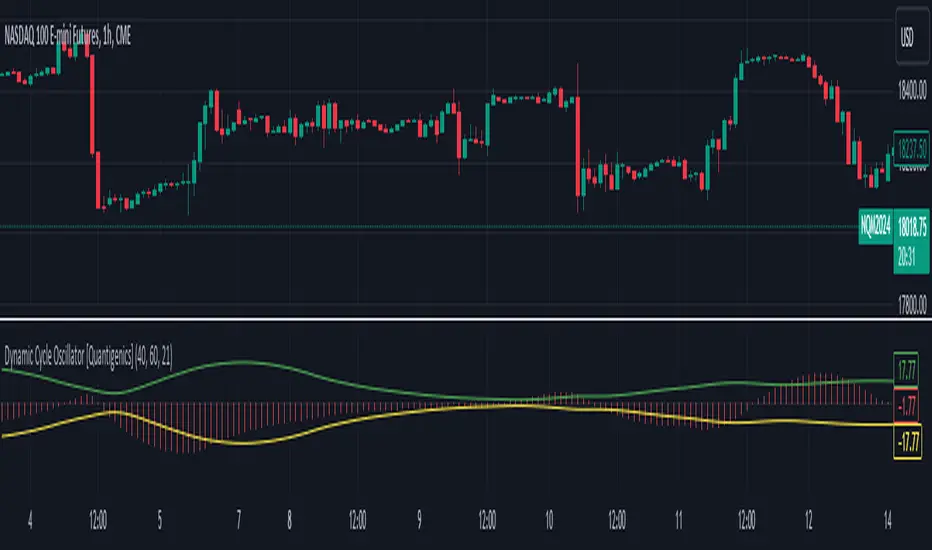
The script operates by plotting two distinct lines and a central histogram that collectively form a band structure: a center line and two outer boundaries, indicating overbought and oversold conditions. The lines are calculated based on a blend of exponential moving averages, which are then refined by a root mean square (RMS) over a specified number of bars to establish the cyclic envelope.
The input parameters:
Using the Script:
On your chart, you’ll notice how the Dynamic Cycle Oscillator’s lines and histogram weave through the price action. Here’s how to interpret the movements.

Thanks! Hope you enjoy!
How It Works:
The script operates by plotting two distinct lines and a central histogram that collectively form a band structure: a center line and two outer boundaries, indicating overbought and oversold conditions. The lines are calculated based on a blend of exponential moving averages, which are then refined by a root mean square (RMS) over a specified number of bars to establish the cyclic envelope.
The input parameters:
- Fast and Slow Periods:
These determine the sensitivity of the script. Shorter periods react quicker to price changes, while longer periods offer a smoother view. - RMS Length:
This parameter controls the range of the cyclic envelope, influencing the trigger levels for trading signals.
Using the Script:
On your chart, you’ll notice how the Dynamic Cycle Oscillator’s lines and histogram weave through the price action. Here’s how to interpret the movements.
- Breakouts and Continuations:Buy Signal: Consider a long position when the histogram crosses above the upper boundary. This suggests a possible strong bullish run.
Sell Signal: Consider a short position when the histogram crosses below the lower boundary. This suggests a possible strong bearish run. - Reversals:Buy Signal: Consider a long position when the histogram crosses above the lower boundary. This suggests an oversold market turning bullish.
Sell Signal: Consider a short position when the histogram crosses below the upper boundary. This implies an overbought market turning bearish.
The script’s real-time analysis can serve as a robust addition to your trading strategy, offering clarity in choppy markets and an edge in trend-following systems.
Thanks! Hope you enjoy!
開源腳本
秉持TradingView一貫精神,這個腳本的創作者將其設為開源,以便交易者檢視並驗證其功能。向作者致敬!您可以免費使用此腳本,但請注意,重新發佈代碼需遵守我們的社群規範。
免責聲明
這些資訊和出版物並非旨在提供,也不構成TradingView提供或認可的任何形式的財務、投資、交易或其他類型的建議或推薦。請閱讀使用條款以了解更多資訊。
開源腳本
秉持TradingView一貫精神,這個腳本的創作者將其設為開源,以便交易者檢視並驗證其功能。向作者致敬!您可以免費使用此腳本,但請注意,重新發佈代碼需遵守我們的社群規範。
免責聲明
這些資訊和出版物並非旨在提供,也不構成TradingView提供或認可的任何形式的財務、投資、交易或其他類型的建議或推薦。請閱讀使用條款以了解更多資訊。