OPEN-SOURCE SCRIPT
SMA Ribbon [A]
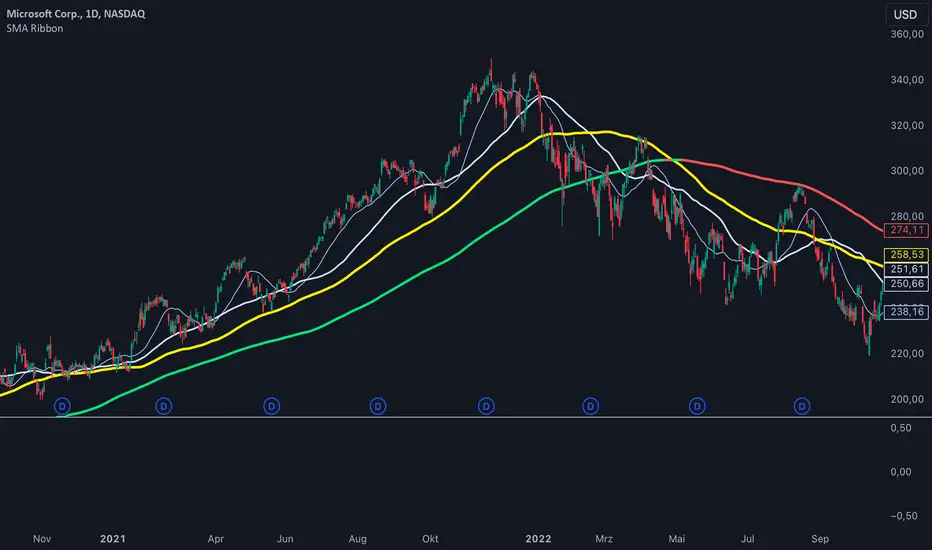
SMA Ribbon with Adjustable MA200
20, 50, 100, and 200-period Simple Moving Averages (SMAs) for trend analysis.
The SMA200 dynamically changes color based on its direction—green when rising and red when falling. Additionally, you can lock the SMA200 to the daily timeframe, allowing it to display the 200-day moving average on lower timeframes, such as 4-hour or 1-hour charts.
Features:
How to Use:
This script is ideal for traders seeking a clean and customizable tool for long-term and short-term trend analysis.
20, 50, 100, and 200-period Simple Moving Averages (SMAs) for trend analysis.
The SMA200 dynamically changes color based on its direction—green when rising and red when falling. Additionally, you can lock the SMA200 to the daily timeframe, allowing it to display the 200-day moving average on lower timeframes, such as 4-hour or 1-hour charts.
Features:
- Dynamic SMA200 Color: Automatically adjusts to show upward (green) or downward (red) trends.
- Daily SMA200 Option: Enables the SMA200 to represent the 200-day moving average on intraday charts for long-term trend insights.
- Smart Adaptation: The daily SMA200 setting is automatically disabled on daily or higher timeframes, ensuring accurate period calculations.
How to Use:
- Use this script to identify key support/resistance levels and overall market trends.
- Adjust the "Daily MA for MA200" option in the settings to toggle between timeframe-specific and daily-locked SMA200.
This script is ideal for traders seeking a clean and customizable tool for long-term and short-term trend analysis.
開源腳本
秉持TradingView一貫精神,這個腳本的創作者將其設為開源,以便交易者檢視並驗證其功能。向作者致敬!您可以免費使用此腳本,但請注意,重新發佈代碼需遵守我們的社群規範。
免責聲明
這些資訊和出版物並非旨在提供,也不構成TradingView提供或認可的任何形式的財務、投資、交易或其他類型的建議或推薦。請閱讀使用條款以了解更多資訊。
開源腳本
秉持TradingView一貫精神,這個腳本的創作者將其設為開源,以便交易者檢視並驗證其功能。向作者致敬!您可以免費使用此腳本,但請注意,重新發佈代碼需遵守我們的社群規範。
免責聲明
這些資訊和出版物並非旨在提供,也不構成TradingView提供或認可的任何形式的財務、投資、交易或其他類型的建議或推薦。請閱讀使用條款以了解更多資訊。