OPEN-SOURCE SCRIPT
Weekly Power 3
Did you know there is a simple line you can place on your chart to immediately make the weeks price action more understandable? Its called the Weekly Open Line. And its the opening price of the trading week. It was created by The Inner Circle Trader (ICT) and incorporates another one of his concepts called Power 3.
The Weekly Power 3 indicator takes the idea of the Weekly Open Line and builds a suite of intelligent and dynamic tools around it that will immediately help the user to start understanding how price moves within the trading week context.
Features
Components
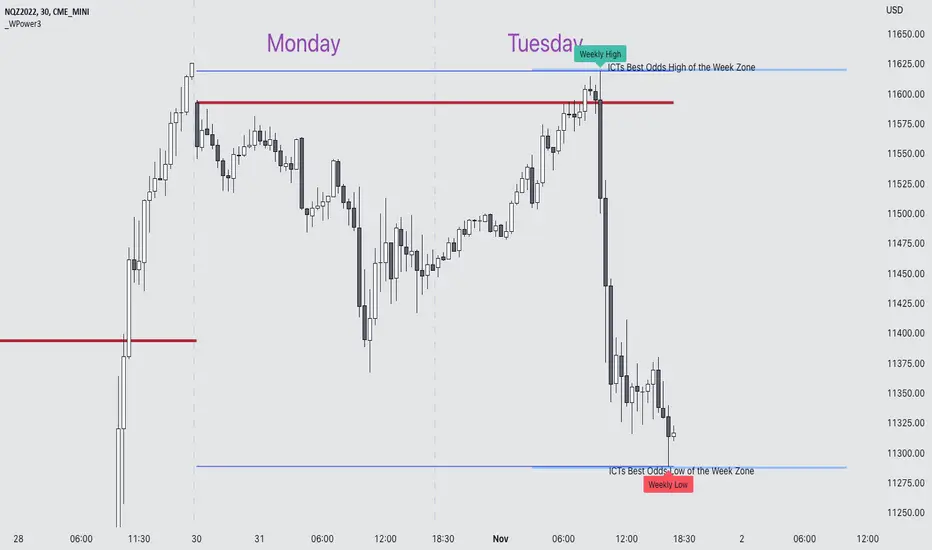
The primary feature is a line that forms on the weekly open price and grows as the week progresses. Additionally, lines are created for the highest and lowest prices of the week so the weekly profile can be easily recognized. A dynamic label marks each weeks highest and lowest point. This will automatically move as prices expand throughout the week.
A very useful component of the Weekly Power 3 indicator is the Days of the Week text. Each Day of the Week text is displayed in the middle of each trading day and also the user can specify in the Settings whether to position the text at the high or low of the weeks price range. Additionally, there is a Buffer setting that allows the user to move the Days of the Week text up or down to prevent chart overlapping.
To help the user visualize the span of time with the best odds of forming the weekly highs or weekly lows, according to ICT, this indicator adds at static line and optional label into the charts future that projects the span from Tuesday’s London Open to Wednesday’s New York. Having a static line out in the future on your chart really helps to picture where price could be drawn to based solely around time of the week.
Premise
ICT says that the weekly open price is the most important level that price reacts to across the five days of a trading week. If the week profile is expected to be bullish then price many times goes below the weekly open line at the beginning of the week and above it later in the week (a.k.a Bullish Power 3). Consequently, if the week is anticipated to be a bearish week, price often times starts the week high and then goes lower throughout the week (a.k.a Bearish Power 3).
ICT always specifies that the weekly high or weekly low have the best odds of forming between the Tuesday’s London Open and Wednesday’s New York Open.
Inputs and Style
Like all scripts publish by Infinity Trading, everything in the indicator is customizable by the user. Every label, line, or text can be individually toggled ON or OFF so the user has complete control over the elements they want displayed on their chart. All of the lines can be individually adjusted by color, line style, or line width. The color and text color on the high and low of the week labels can be individually changed. The text in the chart (day of the week & best odds zones text) each have a “buffer” value. This allows the user to individually move the text up or down on the chart to declutter the chart. And lastly, the day of the week text can be positioned above or below the weeks price action and the text will dynamically move higher or lower as price expands throughout the week.
Previous weeks have all of the Weekly Power 3 markups so it's easy to study past price action and identify trends.
Gallery
View the weeks price action

View multiple weeks price action

Visualize future price action

The Weekly Power 3 indicator takes the idea of the Weekly Open Line and builds a suite of intelligent and dynamic tools around it that will immediately help the user to start understanding how price moves within the trading week context.
Features
- Static Weekly Open Line
- Intelligent Days of the Week Text
- Dynamic Weekly High Line
- Dynamic Weekly Low Line
- Weekly High Candle Label (highest candle of the week)
- Weekly Low Candle Label (lowest candle of the week)
- Best Odds High of the Week Zone Line & Text
- Best Odds Low of the Week Zone Line & Text
Components
The primary feature is a line that forms on the weekly open price and grows as the week progresses. Additionally, lines are created for the highest and lowest prices of the week so the weekly profile can be easily recognized. A dynamic label marks each weeks highest and lowest point. This will automatically move as prices expand throughout the week.
A very useful component of the Weekly Power 3 indicator is the Days of the Week text. Each Day of the Week text is displayed in the middle of each trading day and also the user can specify in the Settings whether to position the text at the high or low of the weeks price range. Additionally, there is a Buffer setting that allows the user to move the Days of the Week text up or down to prevent chart overlapping.
To help the user visualize the span of time with the best odds of forming the weekly highs or weekly lows, according to ICT, this indicator adds at static line and optional label into the charts future that projects the span from Tuesday’s London Open to Wednesday’s New York. Having a static line out in the future on your chart really helps to picture where price could be drawn to based solely around time of the week.
Premise
ICT says that the weekly open price is the most important level that price reacts to across the five days of a trading week. If the week profile is expected to be bullish then price many times goes below the weekly open line at the beginning of the week and above it later in the week (a.k.a Bullish Power 3). Consequently, if the week is anticipated to be a bearish week, price often times starts the week high and then goes lower throughout the week (a.k.a Bearish Power 3).
ICT always specifies that the weekly high or weekly low have the best odds of forming between the Tuesday’s London Open and Wednesday’s New York Open.
Inputs and Style
Like all scripts publish by Infinity Trading, everything in the indicator is customizable by the user. Every label, line, or text can be individually toggled ON or OFF so the user has complete control over the elements they want displayed on their chart. All of the lines can be individually adjusted by color, line style, or line width. The color and text color on the high and low of the week labels can be individually changed. The text in the chart (day of the week & best odds zones text) each have a “buffer” value. This allows the user to individually move the text up or down on the chart to declutter the chart. And lastly, the day of the week text can be positioned above or below the weeks price action and the text will dynamically move higher or lower as price expands throughout the week.
Previous weeks have all of the Weekly Power 3 markups so it's easy to study past price action and identify trends.
Gallery
View the weeks price action
View multiple weeks price action
Visualize future price action
開源腳本
本著TradingView的真正精神,此腳本的創建者將其開源,以便交易者可以查看和驗證其功能。向作者致敬!雖然您可以免費使用它,但請記住,重新發佈程式碼必須遵守我們的網站規則。
免責聲明
這些資訊和出版物並不意味著也不構成TradingView提供或認可的金融、投資、交易或其他類型的意見或建議。請在使用條款閱讀更多資訊。
開源腳本
本著TradingView的真正精神,此腳本的創建者將其開源,以便交易者可以查看和驗證其功能。向作者致敬!雖然您可以免費使用它,但請記住,重新發佈程式碼必須遵守我們的網站規則。
免責聲明
這些資訊和出版物並不意味著也不構成TradingView提供或認可的金融、投資、交易或其他類型的意見或建議。請在使用條款閱讀更多資訊。