OPEN-SOURCE SCRIPT
Candle-Based Negative Space (Improved)
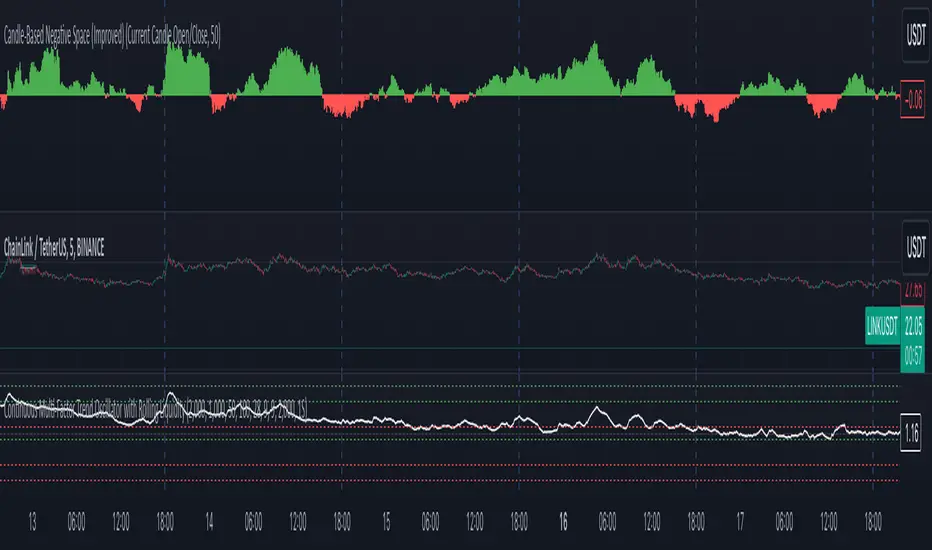
This script visualizes the concept of negative space (when a candle closes below a defined baseline) and positive space (when a candle closes above the baseline) on a price chart. It uses user-defined inputs to configure the baseline and optionally includes a moving average for additional trend analysis. Below is a detailed explanation of the script and suggestions for improving its plotting.
Explanation of the Script
Purpose
The script helps traders visualize the relationship between price movements and a dynamically chosen baseline. The baseline can be based on:
The high/low of the previous candle.
The open/close of the current candle.
The "negative space" is calculated when the closing price is below the baseline, and the "positive space" is calculated when the closing price is above the baseline. The sum of these spaces over a period is plotted as a histogram to provide insights into market strength.
開源腳本
秉持TradingView一貫精神,這個腳本的創作者將其設為開源,以便交易者檢視並驗證其功能。向作者致敬!您可以免費使用此腳本,但請注意,重新發佈代碼需遵守我們的社群規範。
免責聲明
這些資訊和出版物並非旨在提供,也不構成TradingView提供或認可的任何形式的財務、投資、交易或其他類型的建議或推薦。請閱讀使用條款以了解更多資訊。
免責聲明
這些資訊和出版物並非旨在提供,也不構成TradingView提供或認可的任何形式的財務、投資、交易或其他類型的建議或推薦。請閱讀使用條款以了解更多資訊。