OPEN-SOURCE SCRIPT
已更新 ESTOCÁSTICO + NORMALIZED MACD
=== INTRO ===
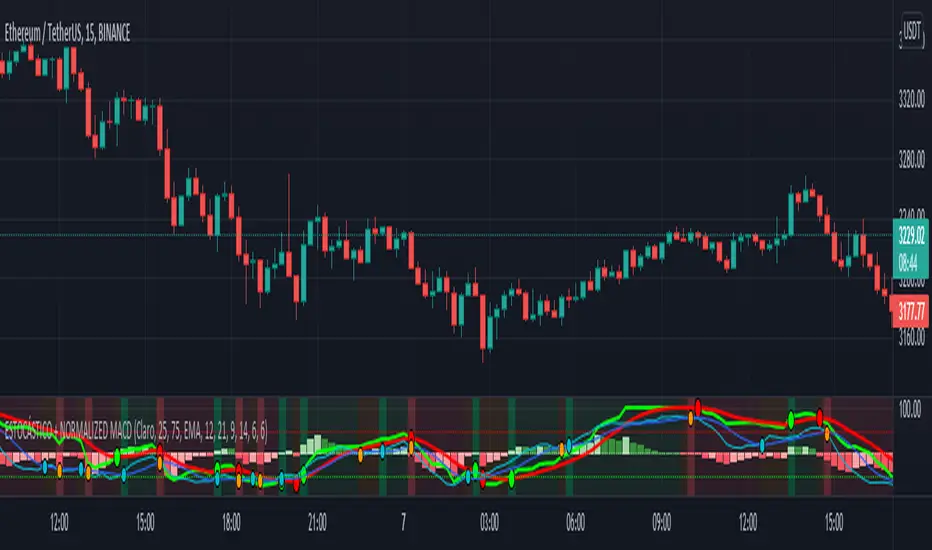
This is a 2 in 1 indicator, STOCHASTIC + NORMALIZED MACD.
I release this script as public because both stochastic and normalized macd are public, so I cannot find any reason to post it as private :)
=== USAGE ===
You can use any of the indicators by itself as usual, stochastic as a oversold/overbought indicator as a momentum/trend indicator.
Usually, crossovers are used for LONG/SHORT entries.
I added dots for crossovers as well as background colors to show movement direction when both indicators agree: green = bullish, red = bearish and orange = range/consolidation.
=== SETTINGS ===
Default settings for both indicators have been changed (but they're of course configurable), to make them work better together.
You can also change NMACD moving average time to SMA or WMA instead of SMA, SMA is really slow for me but give it a try, WMA is more aggressive.
=== RECOMMENDATIONS ===
Always look for higher timeframes, for example, if you're trading 1h, don't try to catch a 1H "ALL GREEN" LONG while 4H is "ALL RED" because otherwise you're just "trying" to catch a bounce in the 1H chart that could never happen, always trade with the main trend.
Try to catch both crossovers in the opposite area, ex: try to LONG when both indicators are below 50 and SHORT above.
I did not test divergences on this indicator, as the MACD is normalized i prefer to use a standard MACD for that, but you can use the stochastic for sure.
發行說明
Added custom oversold and overbought levels, remember, if both indicators make a crossover/cross under on their respective zones trades will be more accurate and safe.Added option to volume weight the MACD.
Stochastic settings changed to K=6 and D=6 by default, this removes fake signals and make it work better with the MACD.
發行說明
English:- Added option to highlight background color ONLY if the NMACD is overbough or oversold when crossover/crossunder occurs.
Español:
- Agregada opción para resaltar el color de fondo SOLO cuando el NMACD está sobrecomprado o sobrevendido cuando ocurren los cruces al alza/baja.
開源腳本
秉持TradingView一貫精神,這個腳本的創作者將其設為開源,以便交易者檢視並驗證其功能。向作者致敬!您可以免費使用此腳本,但請注意,重新發佈代碼需遵守我們的社群規範。
免責聲明
這些資訊和出版物並非旨在提供,也不構成TradingView提供或認可的任何形式的財務、投資、交易或其他類型的建議或推薦。請閱讀使用條款以了解更多資訊。
免責聲明
這些資訊和出版物並非旨在提供,也不構成TradingView提供或認可的任何形式的財務、投資、交易或其他類型的建議或推薦。請閱讀使用條款以了解更多資訊。