OPEN-SOURCE SCRIPT
RSI to Price Ratio
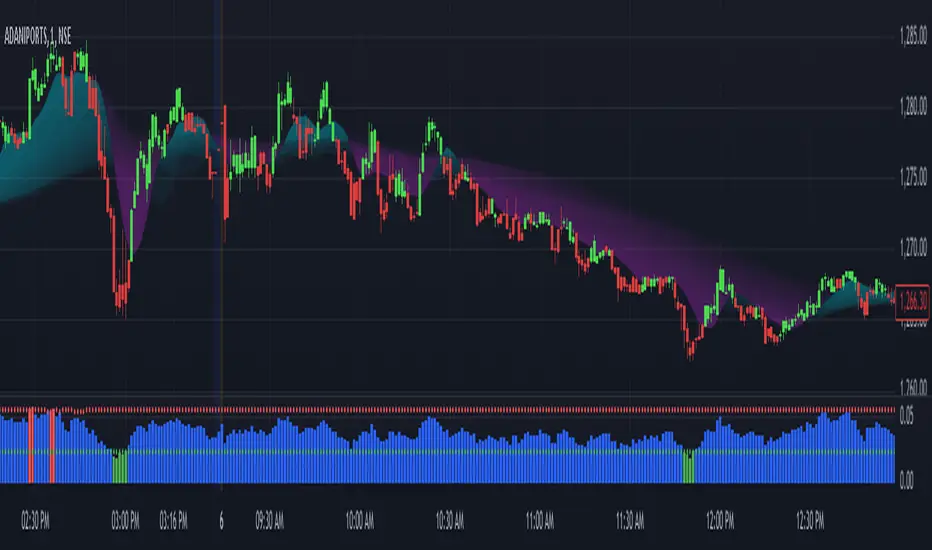
The RSI to Price Ratio is a technical indicator designed to provide traders with a unique perspective by analyzing the relationship between the Relative Strength Index (RSI) and the underlying asset's price. Unlike traditional RSI, which is viewed on a scale from 0 to 100, this indicator normalizes the RSI by dividing it by the price, resulting in a dynamic ratio that adjusts to price movements. The histogram format makes it easy to visualize fluctuations, with distinct color coding for overbought (red), oversold (green), and neutral (blue) conditions.
This indicator excels in helping traders identify potential reversal zones and trend continuation signals. Overbought and oversold levels are dynamically adjusted using the price source, making the indicator more adaptive to market conditions. Additionally, the ability to plot these OB/OS thresholds as lines on the histogram ensures traders can quickly assess whether the market is overstretched in either direction. By combining RSI’s momentum analysis with price normalization, this tool is particularly suited for traders who value precision and nuanced insights into market behavior. It can be used as a standalone indicator or in conjunction with other tools to refine entry and exit strategies.
This indicator excels in helping traders identify potential reversal zones and trend continuation signals. Overbought and oversold levels are dynamically adjusted using the price source, making the indicator more adaptive to market conditions. Additionally, the ability to plot these OB/OS thresholds as lines on the histogram ensures traders can quickly assess whether the market is overstretched in either direction. By combining RSI’s momentum analysis with price normalization, this tool is particularly suited for traders who value precision and nuanced insights into market behavior. It can be used as a standalone indicator or in conjunction with other tools to refine entry and exit strategies.
開源腳本
秉持TradingView一貫精神,這個腳本的創作者將其設為開源,以便交易者檢視並驗證其功能。向作者致敬!您可以免費使用此腳本,但請注意,重新發佈代碼需遵守我們的社群規範。
免責聲明
這些資訊和出版物並非旨在提供,也不構成TradingView提供或認可的任何形式的財務、投資、交易或其他類型的建議或推薦。請閱讀使用條款以了解更多資訊。
免責聲明
這些資訊和出版物並非旨在提供,也不構成TradingView提供或認可的任何形式的財務、投資、交易或其他類型的建議或推薦。請閱讀使用條款以了解更多資訊。