OPEN-SOURCE SCRIPT
parademi 5-8-13
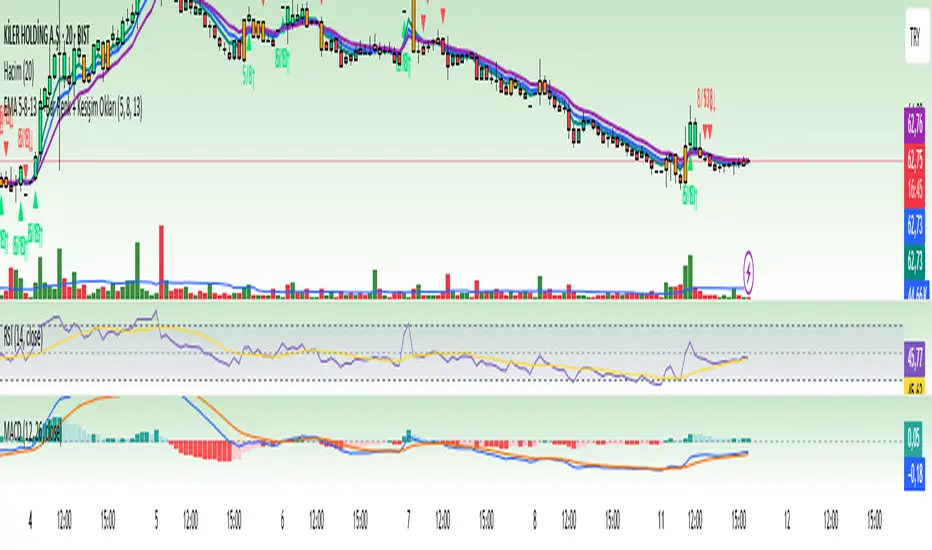
EMA 5-8-13 Trend & Crossover Indicator
This indicator helps you identify market trends and potential reversal points in a single tool. It uses three Exponential Moving Averages (EMA 5, EMA 8, and EMA 13) to determine trend direction and highlight important crossover signals.
Features:
Trend Detection:
When the price is above all three EMAs (5, 8, and 13), candles are colored green, indicating a strong uptrend.
When the price crosses EMA 8, candles turn orange, signaling a possible short-term change in momentum.
Crossover Signals:
When EMA 5 crosses above EMA 8, a green arrow appears below the candle, suggesting a potential buy signal.
When EMA 5 crosses below EMA 8, a red arrow appears above the candle, suggesting a potential sell signal.
Optional EMA 8 and EMA 13 crossover signals can also be displayed using the same logic.
Purpose:
This indicator visually clarifies trend direction and marks potential entry/exit points. It can be used on its own or combined with other technical tools such as volume, support/resistance levels, or momentum indicators for higher accuracy.
開源腳本
秉持TradingView一貫精神,這個腳本的創作者將其設為開源,以便交易者檢視並驗證其功能。向作者致敬!您可以免費使用此腳本,但請注意,重新發佈代碼需遵守我們的社群規範。
免責聲明
這些資訊和出版物並非旨在提供,也不構成TradingView提供或認可的任何形式的財務、投資、交易或其他類型的建議或推薦。請閱讀使用條款以了解更多資訊。
開源腳本
秉持TradingView一貫精神,這個腳本的創作者將其設為開源,以便交易者檢視並驗證其功能。向作者致敬!您可以免費使用此腳本,但請注意,重新發佈代碼需遵守我們的社群規範。
免責聲明
這些資訊和出版物並非旨在提供,也不構成TradingView提供或認可的任何形式的財務、投資、交易或其他類型的建議或推薦。請閱讀使用條款以了解更多資訊。