OPEN-SOURCE SCRIPT
已更新 [KL] Relative Volume + ATR Strategy
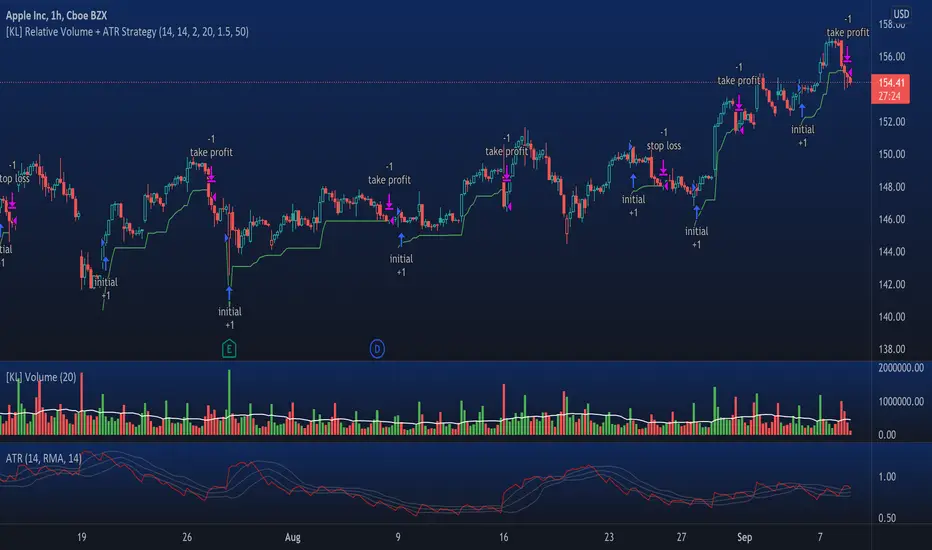
This strategy will enter into long position when (a) current volume is above the average volume, and when (b) volatility of prices (based on ATR) is relatively low.
Backtested on hourly timeframes, win rates range between 35% to 50% on stocks with positive drifts (i.e. tendency to move upwards). Default setups are as follows:
- Average volume is computed using simple moving average (sma) of 14 periods. By default, 1.4x ratio seems to work well on most large cap stocks. If it's too high, then amount of potential points for entry will decrease. But if it's too low, then this indicator becomes meaningless.
- ATR (for determining volatility), look back period is 14 (following conventions). I have noticed that the profits could change drastically when changed to different values for each individually security. Feel free to experiment around with this parameter.
Other information: This strategy is based off of one of my previous scripts; a script called "Relatively Volume Strategy". The objective of this new script is to simplify the process of determining periods of low volatility. In this new script, we assume prices are consolidating when current ATR is within its moving average value by +/- one standard deviation.
發行說明
Fixed a bug發行說明
Trend Detection:Inserted entry_signal3 (which measures the Drift of price movements) to determine the direction of trend. Strategy will now avoid entering a trade if entry_signal3 suggests prices are moving in a downtrend. Furthermore, this condition can be turned on/off in settings allowing user to compare backtested results.
Generally speaking, this feature will reduce the total number of trades taken, especially bad ones, hence likely to reduce drawdown and improve profit factors. By default, the lookback period length is 50 (which was arbitrarily determined, and seems to work well on hour charts of large cap stocks).
I have recently published an indicator script called "Drift Study (Inspired by Monte Carlo Simulations with BM)". This can be added to the charts for better visualizations.
If added to the chart, make sure the lookback periods are the same.
開源腳本
本著TradingView的真正精神,此腳本的創建者將其開源,以便交易者可以查看和驗證其功能。向作者致敬!雖然您可以免費使用它,但請記住,重新發佈程式碼必須遵守我們的網站規則。
免責聲明
這些資訊和出版物並不意味著也不構成TradingView提供或認可的金融、投資、交易或其他類型的意見或建議。請在使用條款閱讀更多資訊。
開源腳本
本著TradingView的真正精神,此腳本的創建者將其開源,以便交易者可以查看和驗證其功能。向作者致敬!雖然您可以免費使用它,但請記住,重新發佈程式碼必須遵守我們的網站規則。
免責聲明
這些資訊和出版物並不意味著也不構成TradingView提供或認可的金融、投資、交易或其他類型的意見或建議。請在使用條款閱讀更多資訊。