OPEN-SOURCE SCRIPT
已更新 Supertrend with Stochastic OB/OS Arrows @KING
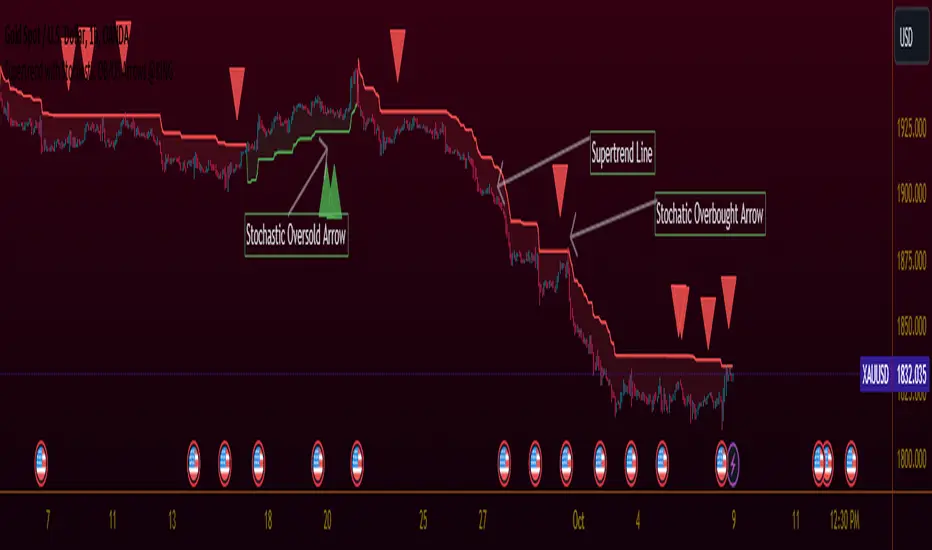
TradingView Idea: Supertrend with Stochastic Arrows KING
Overview:
- Combining the Supertrend indicator with Stochastic arrows for a comprehensive market
view, providing insights into trend direction and potential reversal points.
Supertrend Settings:
- ATR Length: The length parameter for calculating the Average True Range (ATR).
- Factor: A multiplier used to determine the distance of the Supertrend line from the
price.
Supertrend Display:
* The Supertrend is color-coded:
- During an uptrend, it is displayed in green.
- During a downtrend, it is displayed in red.
- The body of the candlesticks is filled with color during the corresponding trend direction.
Stochastic Settings:
- K Length: The period length for the %K line in the Stochastic oscillator.
- K Smoothing: Smoothing factor for %K.
- D Smoothing: Smoothing factor for %D.
- Overbought Level: The threshold indicating an overbought condition.
- Oversold Level: The threshold indicating an oversold condition.
Arrows:
- Buy arrows are displayed below the bars during a downtrend when Stochastic is below the
oversold level.
- Sell arrows are displayed above the bars during an uptrend when Stochastic is above the
overbought level.
Supertrend Display:
- The Supertrend line is plotted with a color change based on its direction.
- The body of the candlesticks is filled with green during an uptrend and red during a downtrend.
Usage:
- Traders can use this script to identify potential entry and exit points, leveraging the
insights provided by both the Supertrend indicator and Stochastic oscillator. This
combination aims to capture trend strength and potential reversal opportunities.
發行說明
TradingView Idea: Supertrend with Stochastic Arrows KING
Overview:
- Combining the Supertrend indicator with Stochastic arrows for a comprehensive market view, providing insights into trend direction and potential reversal points.
Supertrend Settings:
- ATR Length: The length parameter for calculating the Average True Range (ATR).
- Factor: A multiplier used to determine the distance of the Supertrend line from the price.
Supertrend Display:
- The Supertrend is color-coded:
- During an uptrend, it is displayed in green.
- During a downtrend, it is displayed in red.
- The body of the candlesticks is filled with color during the corresponding trend direction.
Stochastic Settings:
- K Length: The period length for the %K line in the Stochastic oscillator.
- K Smoothing: Smoothing factor for %K.
- D Smoothing: Smoothing factor for %D.
- Overbought Level: The threshold indicating an overbought condition.
- Oversold Level: The threshold indicating an oversold condition.
Arrows:
- Buy arrows are displayed below the bars during a downtrend when Stochastic is below the oversold level.
- Sell arrows are displayed above the bars during an uptrend when Stochastic is above the overbought level.
Supertrend Display:
- The Supertrend line is plotted with a color change based on its direction.
- The body of the candlesticks is filled with green during an uptrend and red during a downtrend.
Usage:
- Traders can use this script to identify potential entry and exit points, leveraging the insights provided by both the Supertrend indicator and Stochastic oscillator. This combination aims to capture trend strength and potential reversal opportunities.
---
This format uses for bold and
開源腳本
秉持TradingView一貫精神,這個腳本的創作者將其設為開源,以便交易者檢視並驗證其功能。向作者致敬!您可以免費使用此腳本,但請注意,重新發佈代碼需遵守我們的社群規範。
免責聲明
這些資訊和出版物並非旨在提供,也不構成TradingView提供或認可的任何形式的財務、投資、交易或其他類型的建議或推薦。請閱讀使用條款以了解更多資訊。
開源腳本
秉持TradingView一貫精神,這個腳本的創作者將其設為開源,以便交易者檢視並驗證其功能。向作者致敬!您可以免費使用此腳本,但請注意,重新發佈代碼需遵守我們的社群規範。
免責聲明
這些資訊和出版物並非旨在提供,也不構成TradingView提供或認可的任何形式的財務、投資、交易或其他類型的建議或推薦。請閱讀使用條款以了解更多資訊。