OPEN-SOURCE SCRIPT
Volume MA Breakout T3 [Teyo69]
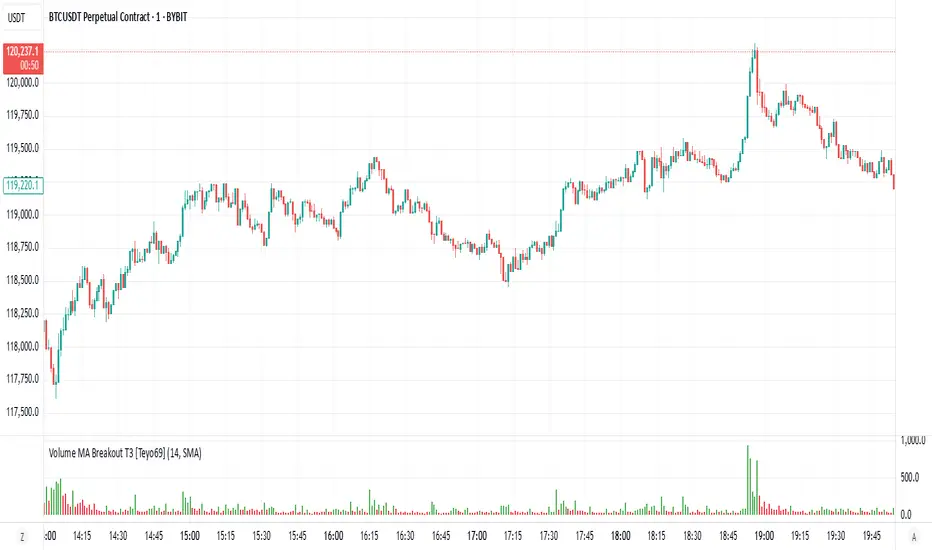
🧭 Overview
Volume MA Breakout T3 [Teyo69] highlights volume bars that exceed a dynamic moving average threshold. It helps traders visually identify volume breakouts—periods of significant buying or selling pressure—based on user-selected MA methods (SMA, EMA, DEMA).
🔍 Features
⚙️ Configuration
📈 How to Use
⚠️ Limitations
🧠 Advanced Tips
📌 Notes
📜 Disclaimer
This script is for educational purposes only. Always test in a simulated environment before live trading. Not financial advice.
Volume MA Breakout T3 [Teyo69] highlights volume bars that exceed a dynamic moving average threshold. It helps traders visually identify volume breakouts—periods of significant buying or selling pressure—based on user-selected MA methods (SMA, EMA, DEMA).
🔍 Features
- Volume Highlighting: Green bars indicate volume breakout above the MA; red bars otherwise.
- Custom MA Options: Choose between SMA, EMA, or Double EMA for volume smoothing.
- Dynamic Threshold: The moving average line adjusts based on user-defined length and method.
⚙️ Configuration
- Length: Number of bars used for the moving average calculation (default: 14).
- Method: Type of moving average to use:
- "SMA" - Simple Moving Average
- "EMA" - Exponential Moving Average
- "Double EMA" - Double Exponential Moving Average
📈 How to Use
- Apply to any chart to visualize volume behavior relative to its MA.
- Look for green bars: These suggest volume is breaking out above its recent average—potential signal of momentum.
- Red bars indicate normal/subdued volume.
⚠️ Limitations
- Does not provide directional bias—use with price action or trend confirmation tools.
- Works best with additional context (e.g., support/resistance, candle formations).
🧠 Advanced Tips
- Use shorter MAs (e.g., 5–10) in volatile markets for more responsive signals.
- Combine with OBV, MFI, or accumulation indicators for confluence.
📌 Notes
- This is a volume-based filter, not a signal generator.
- Useful for breakout traders and volume profile enthusiasts.
📜 Disclaimer
This script is for educational purposes only. Always test in a simulated environment before live trading. Not financial advice.
開源腳本
秉持TradingView一貫精神,這個腳本的創作者將其設為開源,以便交易者檢視並驗證其功能。向作者致敬!您可以免費使用此腳本,但請注意,重新發佈代碼需遵守我們的社群規範。
免責聲明
這些資訊和出版物並非旨在提供,也不構成TradingView提供或認可的任何形式的財務、投資、交易或其他類型的建議或推薦。請閱讀使用條款以了解更多資訊。
免責聲明
這些資訊和出版物並非旨在提供,也不構成TradingView提供或認可的任何形式的財務、投資、交易或其他類型的建議或推薦。請閱讀使用條款以了解更多資訊。