PROTECTED SOURCE SCRIPT
Support and Resistance Index {Fournier-Eaton}
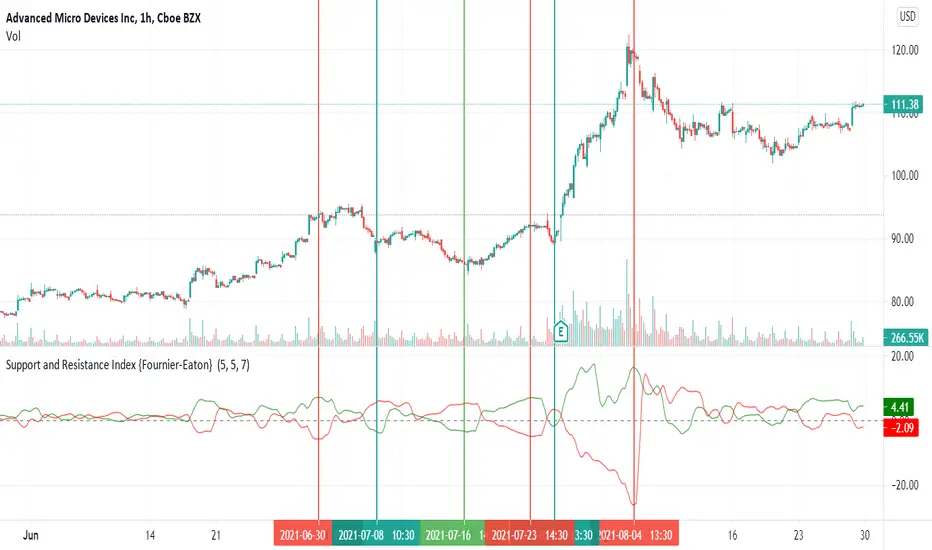
This algorithm quantifies the amount of pressure applied by support and resistance and helps confirm trend initiation as levels, relative to horizontal supports and resistances are broken.
Look for spread in the red and green lines
More succinctly:
Shape and relative values (wide green over red etc), not indicator values are of importance, are the most important.
Feedback is always helpful and I hope you find this useful.
Look for spread in the red and green lines
- A low spread will usually indicate a rangebound stock as it is pressured on both sides equally by resistance and support
- A high spread will typically indicate a stock prepared to make a new directional move.
- A widening spread will indicate the continuation of a trend
- A narrowing spread will indicate the beginning of a reversal.
More succinctly:
- A large spread with RED OVER GREEN indicates a high probability of upward reversal -- think downtrend is exhausted.
- A large spread with GREEN OVER RED indicates a high probability of downward reversal -- think uptrend is exhausted.
Shape and relative values (wide green over red etc), not indicator values are of importance, are the most important.
Feedback is always helpful and I hope you find this useful.
受保護腳本
此腳本以閉源形式發佈。 不過,您可以自由使用,沒有任何限制 — 點擊此處了解更多。
免責聲明
這些資訊和出版物並非旨在提供,也不構成TradingView提供或認可的任何形式的財務、投資、交易或其他類型的建議或推薦。請閱讀使用條款以了解更多資訊。
免責聲明
這些資訊和出版物並非旨在提供,也不構成TradingView提供或認可的任何形式的財務、投資、交易或其他類型的建議或推薦。請閱讀使用條款以了解更多資訊。