OPEN-SOURCE SCRIPT
Deviation rate of Chinese stock market index
// Deviation rate of Chinese stock market index
//The purpose of the indicator is to monitor the Chinese stock market index deviation rate to the 20EMA, so each major index can be observed longitudinally at the same time.
//This indicator give signal of which Index or instrument should you be focused and when should you enter the market to get a long or short position.
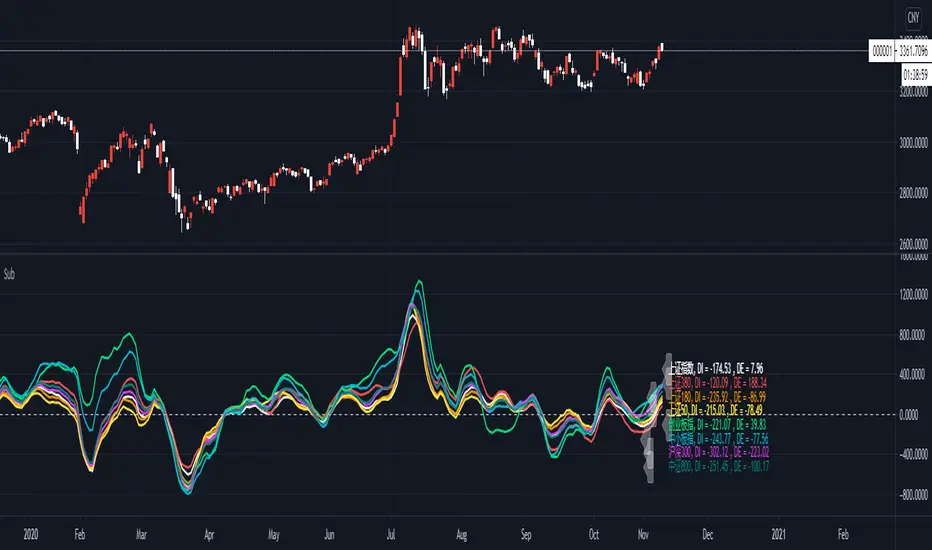
//The chart shows the deviation rate between the current price of each major index current price to the 20EMA.
//Also it count a deductive ratio between current price to the previous 20th bar close price to (which lead to the slope of the 20SMA)
//When using, adjust the corresponding period according to the chart period.
//The word DI (divergence) represents the deviation value between the current price and 20EMA, and DE (deduction) represents the deviation value between the current price and the 20 deduction price.
//Attention marker: The marker tells one of the moving average (EMA20 and MA20) is turning towards the opposite direction. When DE and DI one is plus , one is minus [divergence ratio>0 and deduction ratio <0 ( or vise versa)] attention marker appear on the instrument title.
//Take the bull trend as an example. If the price is higher than ema20, the EMA20 is turning.If the price is higher than the close price of the bar 20 days ago , the sma20 is turning.
//When the ema20 has not turned around to opposite direction , and the ma20 is turning , the deviation rate of the moving average and the deviation rate of the deductible price are different in positive or negative.
//The marker as a reminder will appear on the instrument title.
//How to use this watchlist: You can freely replace the major indices with the instrument you are focused.
//The purpose of the indicator is to monitor the Chinese stock market index deviation rate to the 20EMA, so each major index can be observed longitudinally at the same time.
//This indicator give signal of which Index or instrument should you be focused and when should you enter the market to get a long or short position.
//The chart shows the deviation rate between the current price of each major index current price to the 20EMA.
//Also it count a deductive ratio between current price to the previous 20th bar close price to (which lead to the slope of the 20SMA)
//When using, adjust the corresponding period according to the chart period.
//The word DI (divergence) represents the deviation value between the current price and 20EMA, and DE (deduction) represents the deviation value between the current price and the 20 deduction price.
//Attention marker: The marker tells one of the moving average (EMA20 and MA20) is turning towards the opposite direction. When DE and DI one is plus , one is minus [divergence ratio>0 and deduction ratio <0 ( or vise versa)] attention marker appear on the instrument title.
//Take the bull trend as an example. If the price is higher than ema20, the EMA20 is turning.If the price is higher than the close price of the bar 20 days ago , the sma20 is turning.
//When the ema20 has not turned around to opposite direction , and the ma20 is turning , the deviation rate of the moving average and the deviation rate of the deductible price are different in positive or negative.
//The marker as a reminder will appear on the instrument title.
//How to use this watchlist: You can freely replace the major indices with the instrument you are focused.
開源腳本
秉持TradingView一貫精神,這個腳本的創作者將其設為開源,以便交易者檢視並驗證其功能。向作者致敬!您可以免費使用此腳本,但請注意,重新發佈代碼需遵守我們的社群規範。
免責聲明
這些資訊和出版物並非旨在提供,也不構成TradingView提供或認可的任何形式的財務、投資、交易或其他類型的建議或推薦。請閱讀使用條款以了解更多資訊。
免責聲明
這些資訊和出版物並非旨在提供,也不構成TradingView提供或認可的任何形式的財務、投資、交易或其他類型的建議或推薦。請閱讀使用條款以了解更多資訊。