OPEN-SOURCE SCRIPT
已更新 smoothed_rsi
Description:
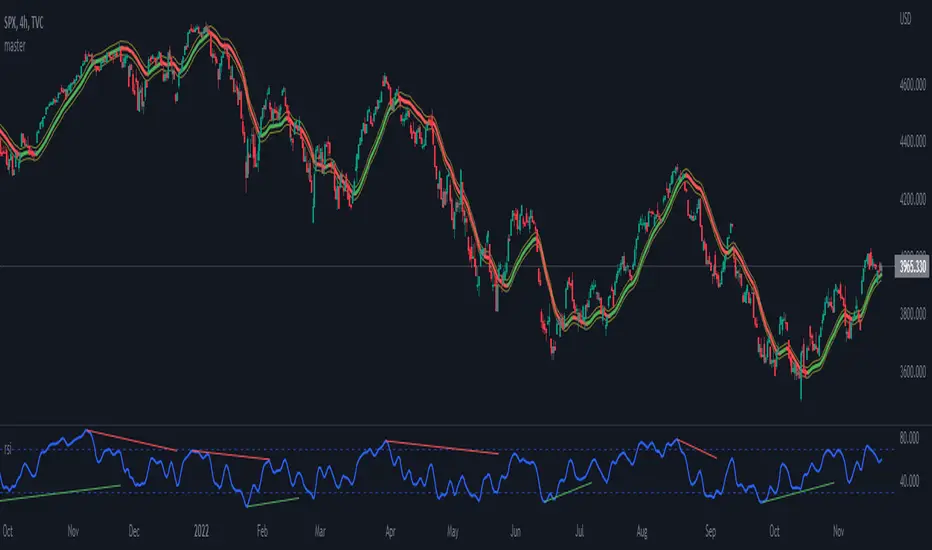
A well-known and vastly used momentum indicator, a Relative Strength Index (RSI) by J. Welles Wilder Jr., aims to evaluate the current price to its oversold/overbought area while giving an overview of bearish/bullish momentum. In this indicator, simply adding the super-smoother function (John F. Ehlers) was applied to the RSI line to create a more smoothed line and reduce its noise.
RSI:
RSI = 100 - 100/(1+RS)
RS = AvgUp/AvgDown
super_smoother(rsi)
Notes:
- RSI > 70 indicates overbought
- RSI < 30 indicates oversold
- direction of the RSI line
發行說明
adding trendline options to identify e.g. divergence occurrence開源腳本
秉持TradingView一貫精神,這個腳本的創作者將其設為開源,以便交易者檢視並驗證其功能。向作者致敬!您可以免費使用此腳本,但請注意,重新發佈代碼需遵守我們的社群規範。
免責聲明
這些資訊和出版物並非旨在提供,也不構成TradingView提供或認可的任何形式的財務、投資、交易或其他類型的建議或推薦。請閱讀使用條款以了解更多資訊。
開源腳本
秉持TradingView一貫精神,這個腳本的創作者將其設為開源,以便交易者檢視並驗證其功能。向作者致敬!您可以免費使用此腳本,但請注意,重新發佈代碼需遵守我們的社群規範。
免責聲明
這些資訊和出版物並非旨在提供,也不構成TradingView提供或認可的任何形式的財務、投資、交易或其他類型的建議或推薦。請閱讀使用條款以了解更多資訊。