OPEN-SOURCE SCRIPT
已更新 Stochastic RSI Heat Candles Overlay
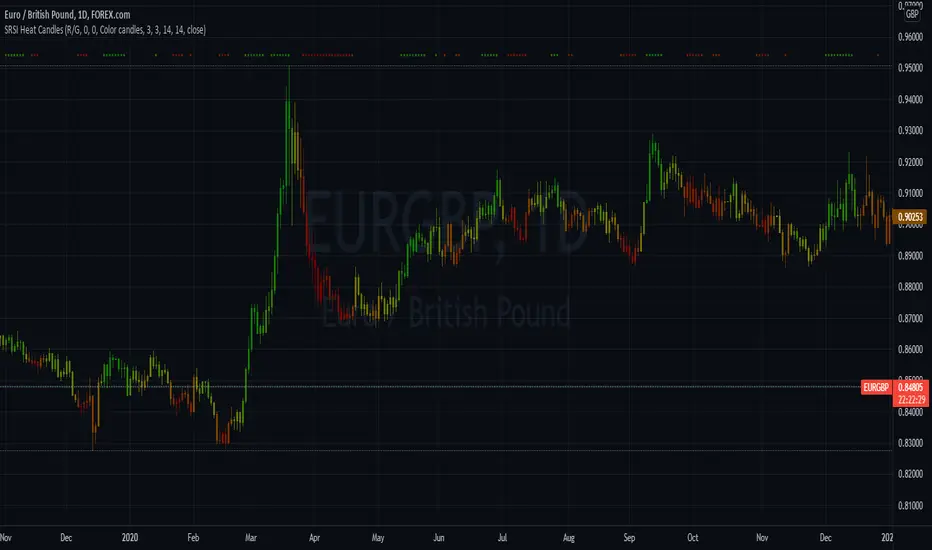
This script is based on the Stochastic RSI indicator.
Candles are dynamically colored with a customizable RGB shading directly generated from the average Stochastic RSI current value.
By default, colors represent the following status -> green is overgought & red is oversold.
Options:
Examples:


Notes:
Candles are dynamically colored with a customizable RGB shading directly generated from the average Stochastic RSI current value.
By default, colors represent the following status -> green is overgought & red is oversold.
Options:
- Shading colors: Choose between Red/Green, Green/Blue, and Blue/Red shadings to represent the SRSI heat.
- Invert colors: Switch colors of the selected shading.
- Third color: Select a value from 0 to 255 for the third color which does not vary.
- Transparency: Select the transparency value.
- Overlay style : Choose to color the whole candle, or only borders and wick.
- Show candle side: If you choose to fully fill candles with the SRSI heat color , enable this option to plot shapes representing the candles directions.
- Candle marks colors: Select bull and bear colors for direction shapes.
- Overbought and Oversold situations are also represented by colored shapes at the top of the chart.
- Standards Stochastic RSI parameters.
Examples:
Notes:
- Do not forget to bring the script to the front of your chart to avoid being covered by default candles.
- Next improvements would probably be a better coloring algorithm, however, do not hesitate to suggest any modifications in comments.
- Initially, I shared a Stochastic RSI Heat Bollinger Bands indicator which gave me the idea to develop this one, you can find it on my profile.
發行說明
Useless lines removed開源腳本
秉持TradingView一貫精神,這個腳本的創作者將其設為開源,以便交易者檢視並驗證其功能。向作者致敬!您可以免費使用此腳本,但請注意,重新發佈代碼需遵守我們的社群規範。
免責聲明
這些資訊和出版物並非旨在提供,也不構成TradingView提供或認可的任何形式的財務、投資、交易或其他類型的建議或推薦。請閱讀使用條款以了解更多資訊。
免責聲明
這些資訊和出版物並非旨在提供,也不構成TradingView提供或認可的任何形式的財務、投資、交易或其他類型的建議或推薦。請閱讀使用條款以了解更多資訊。