OPEN-SOURCE SCRIPT
Constantly Applied Pressure Index (CAP index)
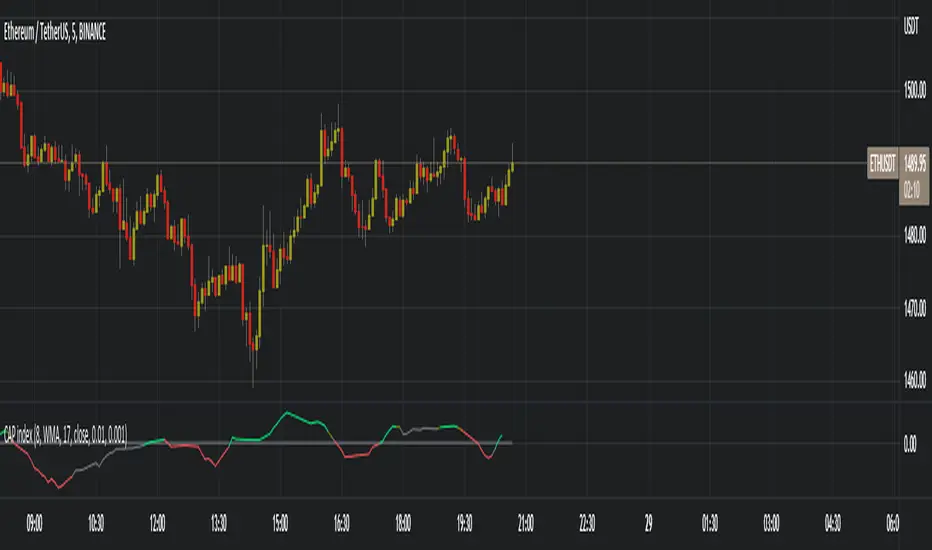
The CAP index is my own homebrew trend indicator made to help traders see the slightly bigger picture, because we all know that as traders we can tend to hyper-focus in on a few candles and end up making a stupid trade because of it, or is it just me ? On a more serious note this indicator helps you find the short term trend by looking at bullish and bearish candles comparing their sizes, volumes and predominance.
The indicator has many technical settings for you to play around with but on the defaults it will render in a few colors which I will explain. Gray means no trend or that the current trend has died, bright green or red mean that a trend has formed, is playing out or that there is a good change a strong trend is about to form. Obviously green means bullish and red means bearish. Finally darker green and red mean a weak or weakening trend, this serves as a warning if you are about to take a trade in the trend direction.
The way I recommend using the indicator is the same way many trend indicators are used, as a filter to either a different indicator creating trading signals or to your own strategy's signals. I would add an illustration here that I prepared but I cannot because of tradingview's reputation rules
開源腳本
秉持TradingView一貫精神,這個腳本的創作者將其設為開源,以便交易者檢視並驗證其功能。向作者致敬!您可以免費使用此腳本,但請注意,重新發佈代碼需遵守我們的社群規範。
免責聲明
這些資訊和出版物並非旨在提供,也不構成TradingView提供或認可的任何形式的財務、投資、交易或其他類型的建議或推薦。請閱讀使用條款以了解更多資訊。
開源腳本
秉持TradingView一貫精神,這個腳本的創作者將其設為開源,以便交易者檢視並驗證其功能。向作者致敬!您可以免費使用此腳本,但請注意,重新發佈代碼需遵守我們的社群規範。
免責聲明
這些資訊和出版物並非旨在提供,也不構成TradingView提供或認可的任何形式的財務、投資、交易或其他類型的建議或推薦。請閱讀使用條款以了解更多資訊。