OPEN-SOURCE SCRIPT
Pi Frame (Dynamic)
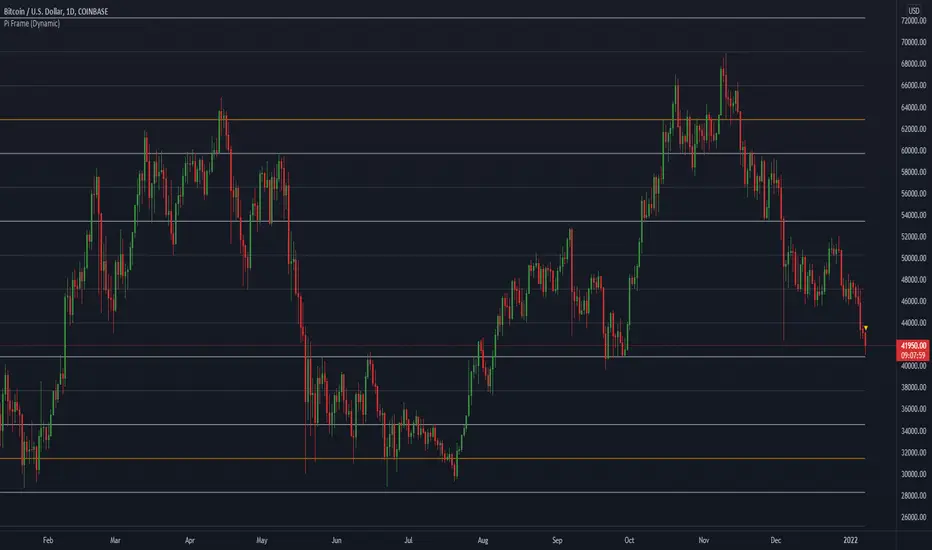
Pi frame posted as lines instead of plots, allowing for complete colour change and extension.
Be warned, the entire frame moves in real time with price so do not look at the corresponding lines for scale factors below (i.e. it will show the current levels in this graph for also under 10k).
To see the correct levels for the <10k range you can use the TV replay function or refer to my "Pi Price Levels" script, which plots accordingly with scale factor.
開源腳本
秉持TradingView一貫精神,這個腳本的創作者將其設為開源,以便交易者檢視並驗證其功能。向作者致敬!您可以免費使用此腳本,但請注意,重新發佈代碼需遵守我們的社群規範。
免責聲明
這些資訊和出版物並非旨在提供,也不構成TradingView提供或認可的任何形式的財務、投資、交易或其他類型的建議或推薦。請閱讀使用條款以了解更多資訊。
免責聲明
這些資訊和出版物並非旨在提供,也不構成TradingView提供或認可的任何形式的財務、投資、交易或其他類型的建議或推薦。請閱讀使用條款以了解更多資訊。