OPEN-SOURCE SCRIPT
已更新 Falcon Liquidity Grab Strategy
How to Use This Script for Commodities and Indices
Best Timeframes: Start with 15-minute charts but test on higher timeframes like 1 hour for indices.
Risk Settings: Adjust the stop_loss_points and take_profit_multiplier to match the volatility of the chosen instrument.
Best Timeframes: Start with 15-minute charts but test on higher timeframes like 1 hour for indices.
Risk Settings: Adjust the stop_loss_points and take_profit_multiplier to match the volatility of the chosen instrument.
發行說明
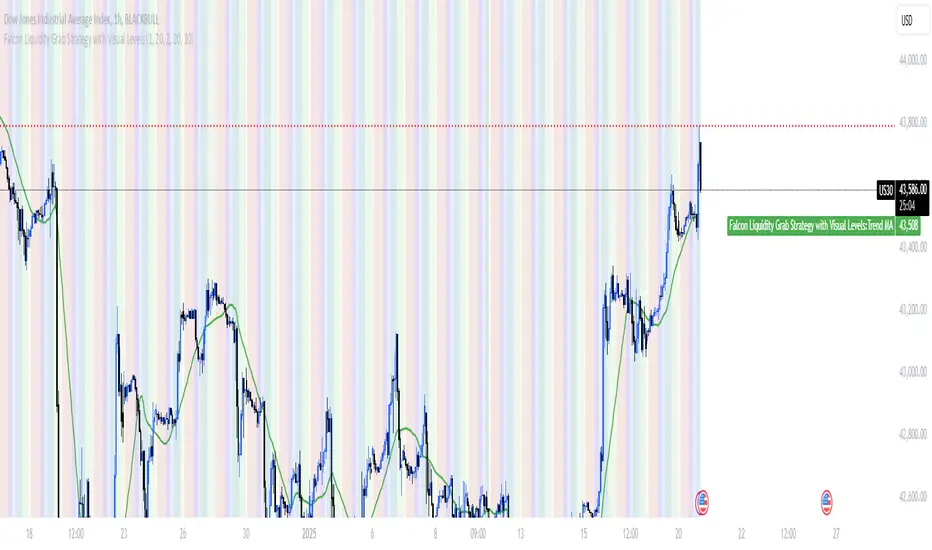
Explanation of AdditionsTake-Profit Levels (Green Dotted Lines):
A green dotted line is drawn at the take-profit level for both long and short trades.
These lines adjust dynamically based on the calculated take-profit level.
Stop-Loss Levels (Red Dotted Lines):
A red dotted line is drawn at the stop-loss level for both long and short trades.
These lines adjust dynamically based on the calculated stop-loss level.
Entry Level Block:
A solid blue line is drawn at the entry price to visually highlight where the trade begins.
Session Background Colors:
Session backgrounds remain the same to help contextualize the trades.
開源腳本
秉持TradingView一貫精神,這個腳本的創作者將其設為開源,以便交易者檢視並驗證其功能。向作者致敬!您可以免費使用此腳本,但請注意,重新發佈代碼需遵守我們的社群規範。
免責聲明
這些資訊和出版物並非旨在提供,也不構成TradingView提供或認可的任何形式的財務、投資、交易或其他類型的建議或推薦。請閱讀使用條款以了解更多資訊。
免責聲明
這些資訊和出版物並非旨在提供,也不構成TradingView提供或認可的任何形式的財務、投資、交易或其他類型的建議或推薦。請閱讀使用條款以了解更多資訊。