OPEN-SOURCE SCRIPT
Real Close Overlay for Heiken Ashi

Description:
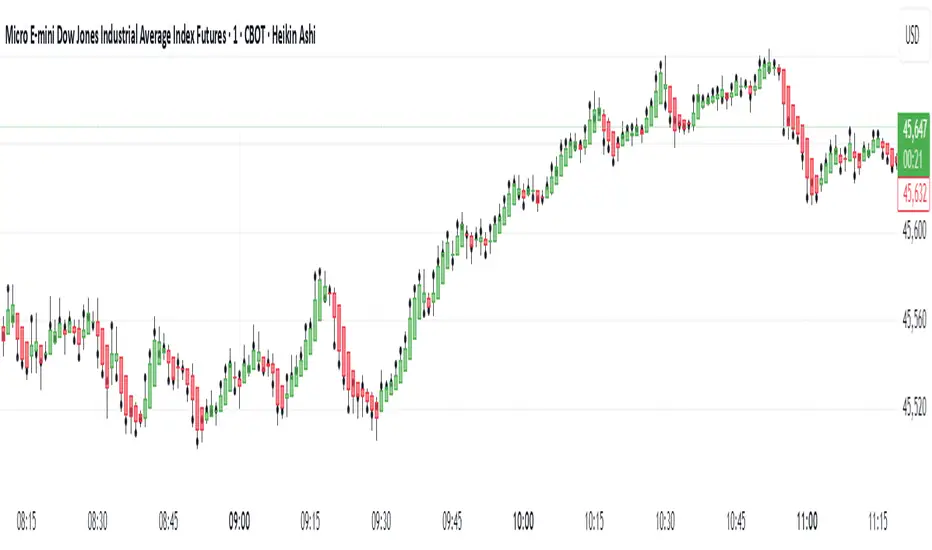
The Real Close on Heiken Ashi indicator solves one of the biggest problems traders face when using Heiken Ashi candles, the fact that the displayed close is not the true market close.
By default, Heiken Ashi modifies the open, high, low, and close values to create smoother-looking candles. This makes them great for identifying trends, but it also means entries and exits can be misleading if you rely only on the chart.
This tool fixes that by overlaying the real closing price (traditional candlestick close) directly onto your Heiken Ashi chart.
How It Works:
- Plots the true closing price of each bar (from standard candles) onto your Heiken Ashi chart.
- Displays a small, unobtrusive marker (black dot by default) so you can instantly see where price actually closed. Not only does it plot the close, but it moves with real price as the candle is forming so price action is not lost.
- Updates in real time with every new bar.
Why It Matters:
- Use Heiken Ashi for trend clarity without losing price accuracy.
- Avoid entering/exiting based on inaccurate Heiken Ashi body closes.
- Improves stop-loss and take-profit placement by showing where price truly ended the candle.
- Essential for scalpers and short-term traders who need precision without losing true price action.
Best Uses:
- Combine with Heiken Ashi for momentum trading.
- Verify breakout confirmations against the real close.
- Use as an execution reference if you trade a HA-based system.
Disclaimer:
This script is for educational purposes only. It is open source and fully accessible. It does not provide financial advice. Always test thoroughly before applying to live markets.
開源腳本
秉持TradingView一貫精神,這個腳本的創作者將其設為開源,以便交易者檢視並驗證其功能。向作者致敬!您可以免費使用此腳本,但請注意,重新發佈代碼需遵守我們的社群規範。
122Trades
免責聲明
這些資訊和出版物並非旨在提供,也不構成TradingView提供或認可的任何形式的財務、投資、交易或其他類型的建議或推薦。請閱讀使用條款以了解更多資訊。
開源腳本
秉持TradingView一貫精神,這個腳本的創作者將其設為開源,以便交易者檢視並驗證其功能。向作者致敬!您可以免費使用此腳本,但請注意,重新發佈代碼需遵守我們的社群規範。
122Trades
免責聲明
這些資訊和出版物並非旨在提供,也不構成TradingView提供或認可的任何形式的財務、投資、交易或其他類型的建議或推薦。請閱讀使用條款以了解更多資訊。