OPEN-SOURCE SCRIPT
已更新 RSI Candle 12-Band Spectrum
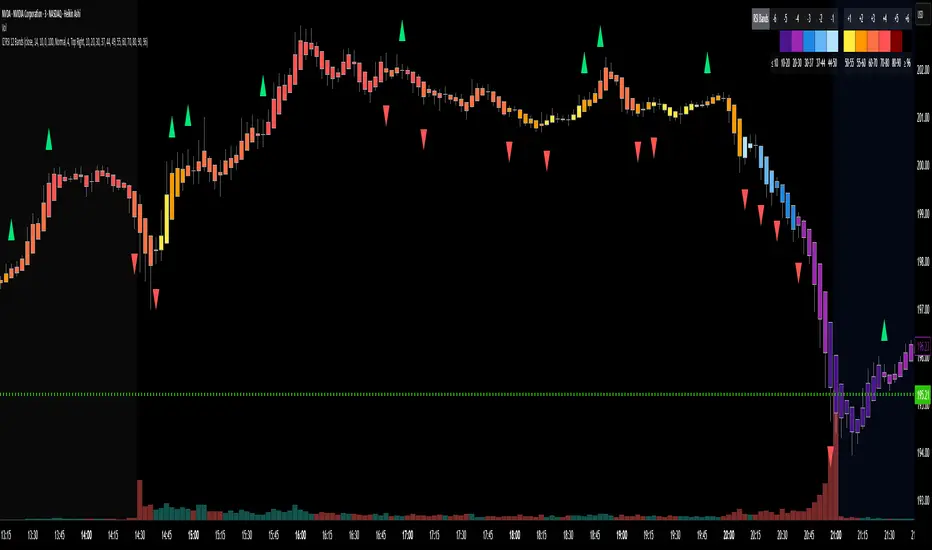
Experience RSI like never before. This multi-band visualizer transforms relative strength into a living color map — directly over price action — revealing momentum shifts long before traditional RSI signals.
🔹 12 Dynamic RSI Bands – A full emotional spectrum from oversold to overbought, colored from deep blue to burning red.
🔹 Adaptive Pulse System – Highlights every shift in RSI state with an intelligent fade-out pulse that measures the strength of each rotation.
🔹 Precision Legend Display – Clear RSI cutoff zones with user-defined thresholds and color ranges.
🔹 Multi-Timeframe Engine – Optionally view higher-timeframe RSI context while scalping lower frames.
🔹 Stealth Mode – Borders-only visualization for minimal chart impact on dark themes.
🔹 Complete Customization – Adjustable band levels, color palettes, and fade behavior.
🧠 Designed for professional traders who move with rhythm, not randomness.
發行說明
🆕 Update v2.0 — “No More Floating Arrows” ✅Complete overhaul of the RSI band-change arrow system for perfect precision.
Arrows are now candle-anchored (abovebar / belowbar) and share the main price scale — no more floating mid-screen.
Cleaner visuals, lighter performance, and 100% accurate alignment across all chart types and timeframes.
開源腳本
秉持TradingView一貫精神,這個腳本的創作者將其設為開源,以便交易者檢視並驗證其功能。向作者致敬!您可以免費使用此腳本,但請注意,重新發佈代碼需遵守我們的社群規範。
免責聲明
這些資訊和出版物並非旨在提供,也不構成TradingView提供或認可的任何形式的財務、投資、交易或其他類型的建議或推薦。請閱讀使用條款以了解更多資訊。
免責聲明
這些資訊和出版物並非旨在提供,也不構成TradingView提供或認可的任何形式的財務、投資、交易或其他類型的建議或推薦。請閱讀使用條款以了解更多資訊。