OPEN-SOURCE SCRIPT
Multi-Pip Grid
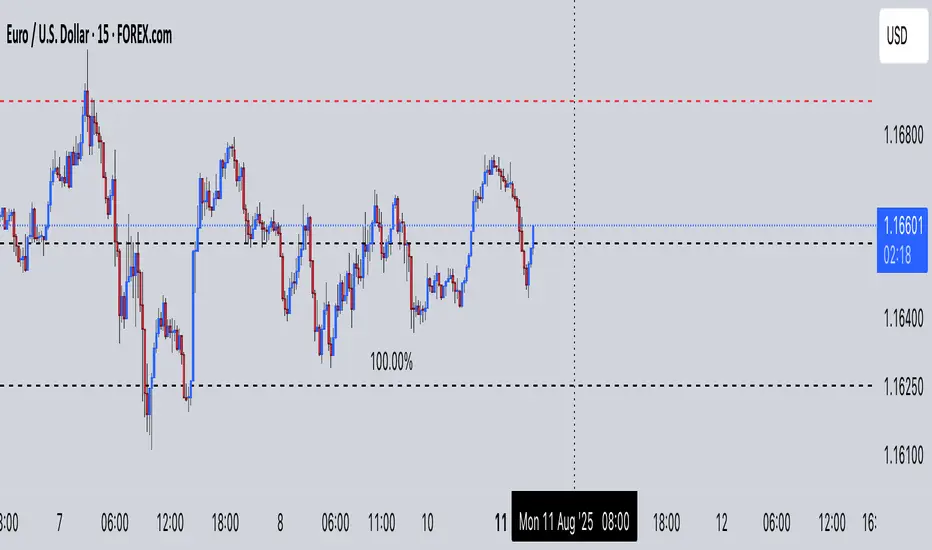
This indicator draws multiple sets of horizontal grid lines on your chart at user-defined pip intervals. It’s designed for traders who want to quickly visualize key price levels spaced evenly apart in pips, with full control over pip size, grid spacing, and appearance.
Features:
Adjustable pip size — works for Forex, gold, crypto, and indices (e.g., 0.0001 for EURUSD, 0.10 for XAUUSD, 1 for NAS100).
Six grid spacings — 1000 pips, 500 pips, 250 pips, 125 pips, 62.5 pips, and 31.25 pips. Each grid can be toggled on or off.
Customizable base price — center the grid at the current market price or any manually entered price.
Optional snap-to-grid — automatically aligns the base price to the nearest multiple of the smallest step for perfect alignment.
Flexible range — choose how many grid lines are drawn above and below the base price.
Distinct colors per grid level for easy identification.
Automatic cleanup — removes old lines before redrawing to avoid clutter.
Use cases:
Identify large and small pip-based support/resistance zones.
Plan entries/exits using fixed pip distances.
Visualize scaled take-profit and stop-loss zones.
Overlay multiple timeframes with consistent pip spacing.
開源腳本
秉持TradingView一貫精神,這個腳本的創作者將其設為開源,以便交易者檢視並驗證其功能。向作者致敬!您可以免費使用此腳本,但請注意,重新發佈代碼需遵守我們的社群規範。
免責聲明
這些資訊和出版物並非旨在提供,也不構成TradingView提供或認可的任何形式的財務、投資、交易或其他類型的建議或推薦。請閱讀使用條款以了解更多資訊。
開源腳本
秉持TradingView一貫精神,這個腳本的創作者將其設為開源,以便交易者檢視並驗證其功能。向作者致敬!您可以免費使用此腳本,但請注意,重新發佈代碼需遵守我們的社群規範。
免責聲明
這些資訊和出版物並非旨在提供,也不構成TradingView提供或認可的任何形式的財務、投資、交易或其他類型的建議或推薦。請閱讀使用條款以了解更多資訊。