OPEN-SOURCE SCRIPT
已更新 [blackcat] L2 Veronique Valcu VWAP Z-Score Indicator
Level: 2
Background
Veronique Valcu's article "Z-Score Indicator" in Feb,2003 provided a description and commentary on a new method of displaying directional change normalized in terms of standard deviation. This indicator is realized in pine script here by using the following function code, adding vwap function, called vwap ZScore.
Function
This indicator has three input, "AvgLen", "Smooth1" and "Smooth2." Price is fixed in selected vwap price. AvgLen describes the length of the sample considered in the standard deviation calculation. Once created and verified, the function can be easily called in any indicator or strategy.
Inputs
AvgLen --> Length input for vwap Zscore.
Smooth1 and Smooth2 --> Smoothing length.
Key Signal
Curve1 --> vwap ZScore output fast signal
Curve2 --> vwap ZScore output slow signal
Remarks
This is a Level 2 free and open source indicator.
Feedbacks are appreciated.
發行說明
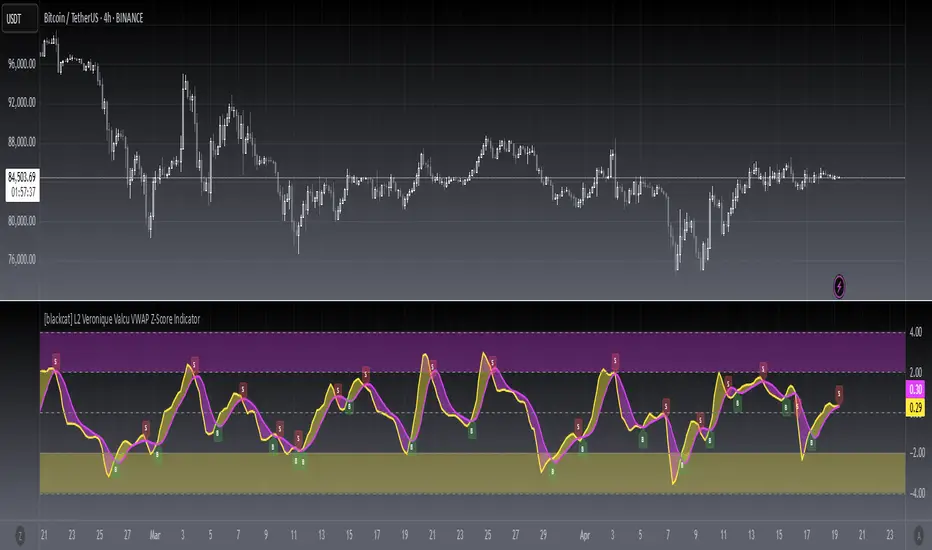
OVERVIEWThe [blackcat] L2 Veronique Valcu VWAP Z-Score Indicator is designed to help traders make informed decisions based on volume-weighted average price (VWAP) and standard deviation. This indicator calculates two smoothed Z-score curves using customizable parameters, providing visual cues for potential trading opportunities. The script plots these curves and fills the area between them, highlighting zones where buying or selling might be advantageous. Additionally, it includes horizontal reference lines at specific Z-score levels and generates alerts for buy/sell signals.
FEATURES
🔹 Customizable Parameters: Adjustable settings for average length and smoothing factors allow users to tailor the indicator to their specific needs.
🔹 Z-Score Curves: Two smoothed Z-score curves provide insights into market conditions.
🔹 Visual Indicators: Filled areas between curves and horizontal lines offer clear visual guidance.
🔹 Buy/Sell Signals: Automatically detects crossover points for generating buy/sell signals.
🔹 Alerts: Generates alerts for buy/sell signals to notify traders of potential opportunities.
HOW TO USE
Add the Script:
📌 Open TradingView and go to the chart where you want to add the indicator.
📌 Click on "Add Indicator" and search for "L2 Veronique Valcu VWAP Z-Score Indicator" by BlackCat.
📌 Select the indicator from the list and click "Add".
Adjust Settings (Optional):
🛠️ Customize the Average Length, Smoothing Factor 1, and Smoothing Factor 2 according to your preferences.
Interpret the Plots:
🎯 Observe the yellow and fuchsia curves representing the Z-scores.
🎯 Look for crossovers between the curves to identify potential buy/sell signals.
🎯 Pay attention to the filled areas between the curves and horizontal lines for additional context.
Set Alerts:
🔔 Configure alerts for buy/sell signals to receive notifications when trading opportunities arise.
LIMITATIONS
⚠️ The effectiveness of this indicator depends on market conditions and should not be used in isolation.
⚠️ Backtesting results may vary and do not guarantee future performance.
⚠️ Always combine this indicator with other forms of analysis for better decision-making.
NOTES
💡 The indicator uses the Volume Weighted Average Price (VWAP) as the base calculation.
💡 Smoothing factors can significantly impact the sensitivity and responsiveness of the indicator.
💡 Horizontal lines at Z-score levels of ±2 and ±4 serve as reference points for extreme values.
開源腳本
秉持TradingView一貫精神,這個腳本的創作者將其設為開源,以便交易者檢視並驗證其功能。向作者致敬!您可以免費使用此腳本,但請注意,重新發佈代碼需遵守我們的社群規範。
Avoid losing contact!Don't miss out! The first and most important thing to do is to join my Discord chat now! Click here to start your adventure: discord.com/invite/ZTGpQJq 防止失联,请立即行动,加入本猫聊天群: discord.com/invite/ZTGpQJq
免責聲明
這些資訊和出版物並非旨在提供,也不構成TradingView提供或認可的任何形式的財務、投資、交易或其他類型的建議或推薦。請閱讀使用條款以了解更多資訊。