PROTECTED SOURCE SCRIPT
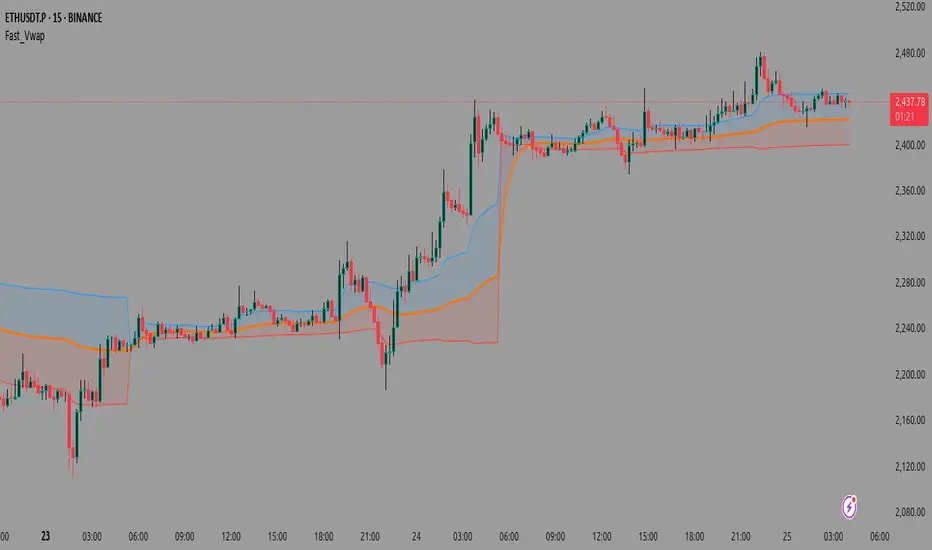
Fast_Vwap
This is a Pine Script indicator that calculates and displays Volume Weighted Average Price (VWAP) with several advanced features, including multiple anchoring methods, deviation bands, and optional machine learning enhancements.
Core Components
1. VWAP Calculation
The indicator calculates VWAP using the standard formula:
text
VWAP = Σ(Price × Volume) / Σ(Volume)
Where price can be customized (default is HLC3 - the average of high, low, and close).
2. Anchoring Methods
The indicator offers four ways to reset/start the VWAP calculation:
Session: Resets at the start of each new trading day (most common)
Lowest Low: Resets when a new 10-bar low occurs
Highest High: Resets when a new 10-bar high occurs
Fixed Length: Resets after a specified number of bars (default 20)
3. Deviation Bands
The indicator can show standard deviation bands around the VWAP:
Upper band = VWAP + (Standard Deviation × Multiplier)
Lower band = VWAP - (Standard Deviation × Multiplier)
4. Machine Learning Enhancements
Two optional ML methods can be applied to smooth the VWAP:
Simple Average: Uses an EMA (Exponential Moving Average) of the VWAP
KNN (K-Nearest Neighbors): A simplified implementation that looks at recent values to adjust the current VWAP
How It Works
Inputs: The user can configure all parameters including price source, anchoring method, band settings, and ML options.
Anchoring: The script first determines when to reset the VWAP calculation based on the selected anchoring method.
VWAP Calculation: Using the anchoring points, it calculates the cumulative price×volume and total volume to compute the VWAP and standard deviation bands.
ML Processing: If enabled, the raw VWAP value is smoothed using either a simple EMA or a KNN algorithm that looks at the most similar recent values.
Visualization: The final VWAP line is plotted along with optional deviation bands and colored fills between the bands and VWAP line.
Use Cases
Intraday Trading: When anchored to session, helps identify fair value during the trading day
Swing Trading: When using fixed length or high/low anchoring, can identify support/resistance
Trend Confirmation: Deviation bands help identify overbought/oversold conditions relative to volume-weighted price
The combination of traditional VWAP with machine learning smoothing makes this a unique tool that can potentially reduce noise while maintaining the volume-weighted price information that makes VWAP valuable.
A deviation band is a statistical tool that creates upper and lower boundaries around a central line (in this case, the VWAP) based on how much prices typically vary from that average.
How It Works
Standard Deviation Calculation
The indicator calculates how much prices deviate from the VWAP:
Measures the "spread" or volatility of prices around the VWAP
Uses the mathematical formula for standard deviation
Creates bands at a specific distance from the VWAP line
What Deviation Bands Tell You
Statistical Significance
~68% of price action typically stays within 1 standard deviation
~95% stays within 2 standard deviations
When price touches the bands, it's statistically "unusual"
Trading Signals
Price hits upper band: Potentially overbought, consider selling
Price hits lower band: Potentially oversold, consider buying
Price stays within bands: Normal price action
Price breaks outside bands: Strong momentum move
Dynamic Adjustment
High volatility periods: Bands automatically widen
Low volatility periods: Bands automatically narrow
Volume changes: Affects both VWAP and band calculations
Orange Line (Default)
What it is: The main VWAP line with machine learning enhancement
Purpose: This is the core signal line - the Volume Weighted Average Price that's been processed through your selected ML method (Simple Average, KNN, or None)
Blue Line (Default)
What it is: Upper deviation band
Purpose: Shows potential resistance level - when price reaches this band, it may indicate overbought conditions
Red Line (Default)
What it is: Lower deviation band
Purpose: Shows potential support level - when price reaches this band, it may indicate oversold conditions
受保護腳本
此腳本以閉源形式發佈。 不過,您可以自由使用,沒有任何限制 — 點擊此處了解更多。
免責聲明
這些資訊和出版物並非旨在提供,也不構成TradingView提供或認可的任何形式的財務、投資、交易或其他類型的建議或推薦。請閱讀使用條款以了解更多資訊。
受保護腳本
此腳本以閉源形式發佈。 不過,您可以自由使用,沒有任何限制 — 點擊此處了解更多。
免責聲明
這些資訊和出版物並非旨在提供,也不構成TradingView提供或認可的任何形式的財務、投資、交易或其他類型的建議或推薦。請閱讀使用條款以了解更多資訊。