OPEN-SOURCE SCRIPT
已更新 MFI Divergence Indicator
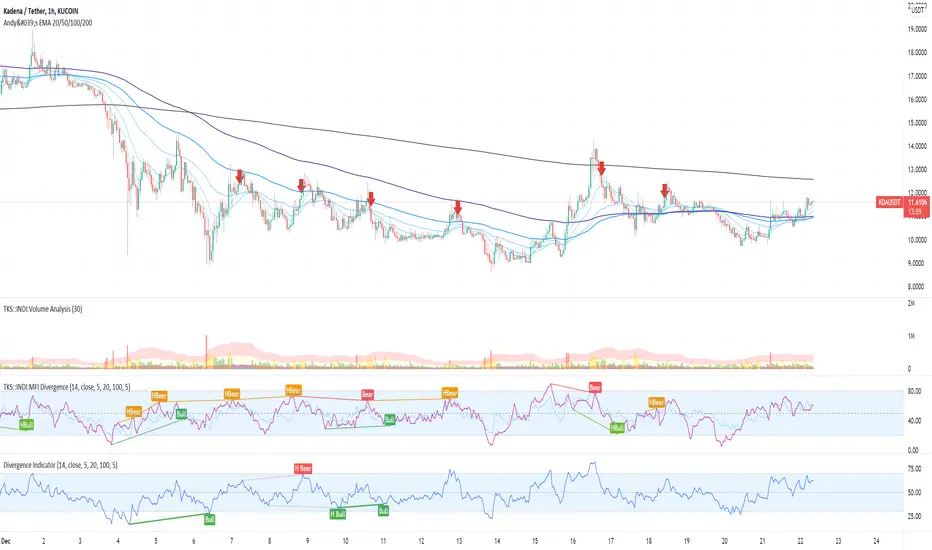
Our Developer Malin converted the built-in RSI divergence indicator to MFI (Money Flow Index).
How to apply?
Notice 1: MFI, unlike the RSI, incorporates volume. It thus is an indicator of a higher precision when it comes to finding the the moment to sell - or - the moment to enter.
Notice 2: In Ranging Markets MFI (and RSI) is a solid momentum indicator to buy or sell. The asset displayed shows a slight markdown. Thus, we are looking primarily for short positions. Once can tell by us omitting the first 2 hidden bearish divergence signals and then entering the market.
Notice 3: Divergences depend on pivot points. The drawback with pivot points is that it is a lagging indication of a potential reversal. The more time (bars) one takes to confirm a reversal the less profitable is the trade - but less risky. In the charts one can tell that we enter the market 5 bars later. Usually that is not the tip of the reversal.
Notice 4: One must adapt the left and right periods of the indicator to risk/reward ratio, length of swing / frequency modulation and volatility of the price action.
Credits: Credits go to the Tradingview Team for delivering the original code. And Malin for the conversion. Please keep the copy right as a courtesy.
發行說明
We added the RSI in light blue to the indicator to understand the difference better. Notice, a big difference of the MFI an RSI is indicating that there is a considerable difference of price and the volume that is backing up the direction of the trend. We will indicate significant differences in future versions.發行說明
Indicating a MFI/RSI-difference of 20% on the chart.發行說明
Indicating any difference of the MFI and RSI. No matter if positive or negative.開源腳本
秉持TradingView一貫精神,這個腳本的創作者將其設為開源,以便交易者檢視並驗證其功能。向作者致敬!您可以免費使用此腳本,但請注意,重新發佈代碼需遵守我們的社群規範。
免責聲明
這些資訊和出版物並非旨在提供,也不構成TradingView提供或認可的任何形式的財務、投資、交易或其他類型的建議或推薦。請閱讀使用條款以了解更多資訊。
開源腳本
秉持TradingView一貫精神,這個腳本的創作者將其設為開源,以便交易者檢視並驗證其功能。向作者致敬!您可以免費使用此腳本,但請注意,重新發佈代碼需遵守我們的社群規範。
免責聲明
這些資訊和出版物並非旨在提供,也不構成TradingView提供或認可的任何形式的財務、投資、交易或其他類型的建議或推薦。請閱讀使用條款以了解更多資訊。