PROTECTED SOURCE SCRIPT
[XIDEN] Reversal Scanner
Xiden's reversal scanner is based on SMA.
It gives you visual reversal zones and possible entries to enter a reversal trade.
We always try to keep the chart clean, so we didn't go back on visuals, just essentials.
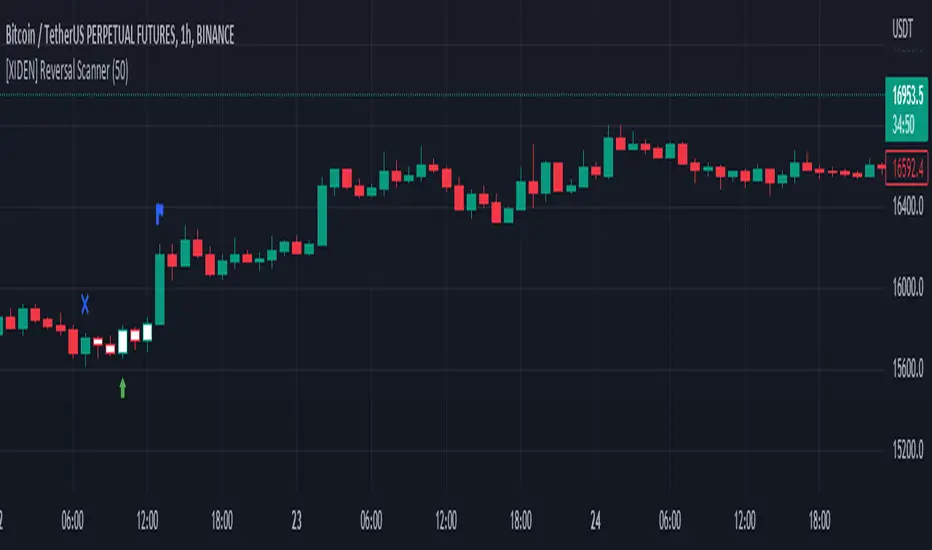
Here is a bullish example:

The blue cross indicates the start of a bullish reversal zone.
The blue flag indicates the end of the bullish reversal zone.
The green arrow marks a possible long entry.
Here is a bearish example:

Again:
The blue cross indicates the start of a bearish reversal zone.
The blue flag indicates the end of the bearish reversal zone.
The red arrow marks a possible short entry.
Don't use this tool as a standalone indicator to trade, always DYOR and use other factors to confirm a possible reversal.
It gives you visual reversal zones and possible entries to enter a reversal trade.
We always try to keep the chart clean, so we didn't go back on visuals, just essentials.
Here is a bullish example:
The blue cross indicates the start of a bullish reversal zone.
The blue flag indicates the end of the bullish reversal zone.
The green arrow marks a possible long entry.
Here is a bearish example:
Again:
The blue cross indicates the start of a bearish reversal zone.
The blue flag indicates the end of the bearish reversal zone.
The red arrow marks a possible short entry.
Don't use this tool as a standalone indicator to trade, always DYOR and use other factors to confirm a possible reversal.
受保護腳本
此腳本以閉源形式發佈。 不過,您可以自由使用,沒有任何限制 — 點擊此處了解更多。
免責聲明
這些資訊和出版物並非旨在提供,也不構成TradingView提供或認可的任何形式的財務、投資、交易或其他類型的建議或推薦。請閱讀使用條款以了解更多資訊。
免責聲明
這些資訊和出版物並非旨在提供,也不構成TradingView提供或認可的任何形式的財務、投資、交易或其他類型的建議或推薦。請閱讀使用條款以了解更多資訊。