PROTECTED SOURCE SCRIPT
AG Relative BandWidth
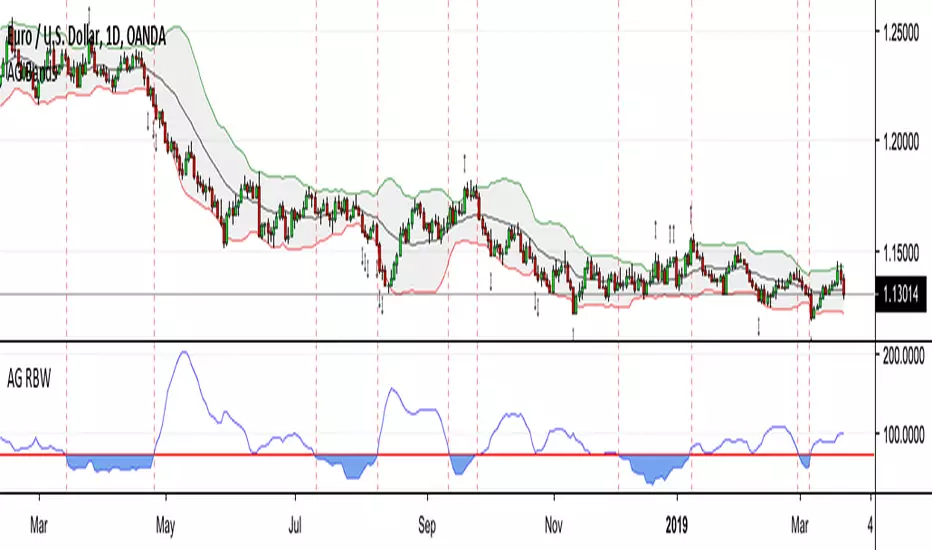
This is an indicator that we've been using for a while, very useful for identifying when the market is in a low volatility state. We use the bandwidth of the Bollinger Bands as a proxy for this, but we do something different - we ask the question of "relative to what?".
Whereas typical Bollinger BandWidth indicators give values only applicable for that particular asset, the normalised nature of our Relative BandWidth indicator means that it works and be inferred the same across all assets and timeframes. A really handy tool!
"After periods of low volatility come periods of high volatility" is a well-known theory, and this indicator helps to quickly and easily identify when markets are in low volatility states. Another name for the information our indicator shows is known as the "Bollinger squeeze". Trading breakouts of this squeeze in Bands can be a profitable strategy, given one can filter the false breakouts adequately.
I have shown examples of when the indicator was showing low volatility, take note of what the price action and the width of the Bollinger Bands are doing.
Every parameter is editable, so feel free to play around with the settings. The default settings are what we have used for a long time and have worked well.
受保護腳本
此腳本以閉源形式發佈。 不過,您可以自由且不受任何限制地使用它 — 在此處了解更多資訊。
免責聲明
這些資訊和出版物並不意味著也不構成TradingView提供或認可的金融、投資、交易或其他類型的意見或建議。請在使用條款閱讀更多資訊。
受保護腳本
此腳本以閉源形式發佈。 不過,您可以自由且不受任何限制地使用它 — 在此處了解更多資訊。
免責聲明
這些資訊和出版物並不意味著也不構成TradingView提供或認可的金融、投資、交易或其他類型的意見或建議。請在使用條款閱讀更多資訊。